LunchBox’s Data components allow users to structure their Grasshopper and Rhino data into tabular formats and export it as a variety of file types.
The included viewers also allow users to create charts and data grids from within Grasshopper, and export the results.
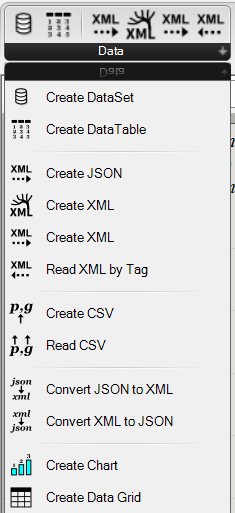
Component Descriptions
Below, each component is described and visual examples are given. We’ve also included special Notes and Tips that can help users with less familiar situations.
Description
Appearance
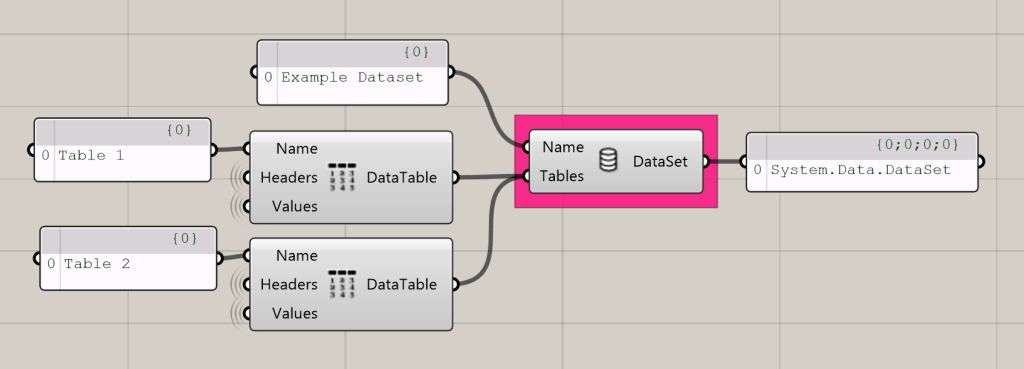
Create DataSet
Allows users to combine multiple DataTables to create a DataSet.
DataSets allow users to structure interrelated data in a tabular format, where each row corresponds to a record number.
Input:
- A text-based Name for the resulting dataset.
- The tables to include within the dataset.
Returns: A DataSet.
Create DataTable
Creates a tabular DataTable where the provided “Headers” are columns, and the “Values” are rows.
Permitted Value types include numerical data (integers or whole numbers), nominal data (text-based or alphanumerical such as a list of GUIDs), or boolean data (such as a list of True/False values).
Input:
- A text-based Name, or title, for the Data Table
- A list of text-based Header names for each column of data
- A structured list of Values that correspond to each Header. Each value will become a row in the DataTable.
Returns: A DataTable
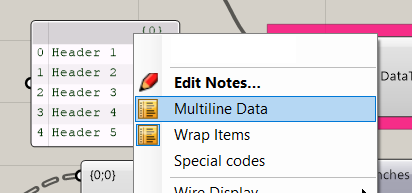
Tip: Ensure that text panels are set to Multiline data to function properly as lists. Right click on the panel and click “Multiline Data” to toggle this function on and off.
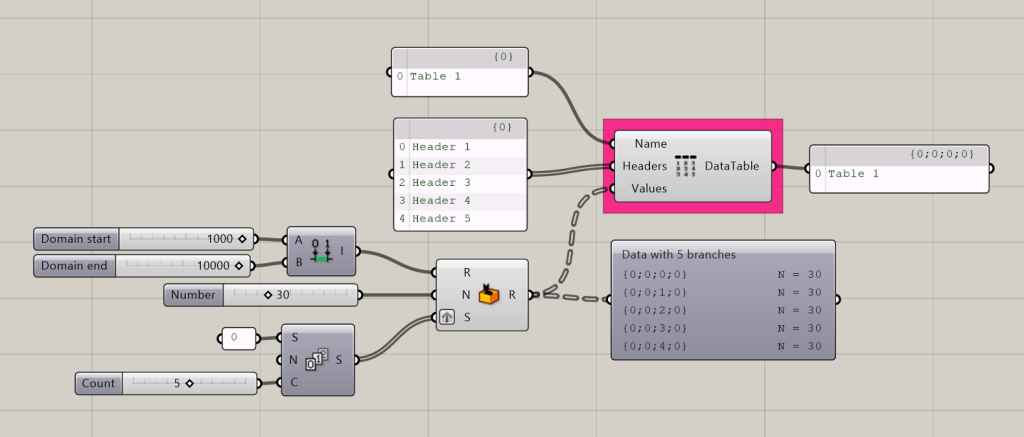
In this example, Random Numbers are being generated to input as Values.
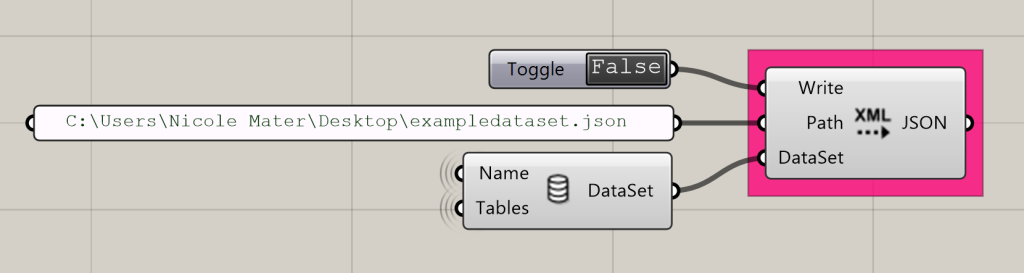
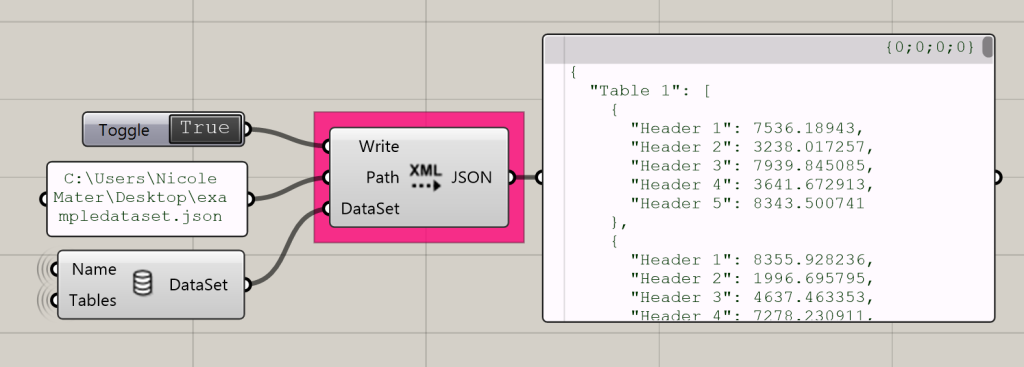
Create JSON
Allows users to export a DataSet as a JSON file to a specified location.
Input:
- A boolean toggle to execute the write function
- A file path with the extension .json, where the file will be written. Tip: the Grasshopper “File Path” component can be used.
- A DataSet
After executing the function, verify the JSON file has been created at the specified destination.
Note: If the boolean toggle is set to “True” and any changes are made to the grasshopper definition, the file will be overwritten. It is best practice to reset the toggle to “False” after creating file to avoid issues.
Important Formatting Note: JSON field names cannot contain spaces. Ensure that Header Names do not have spaces.
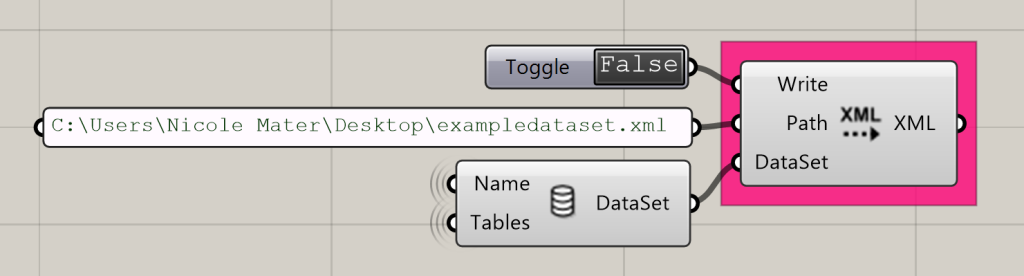
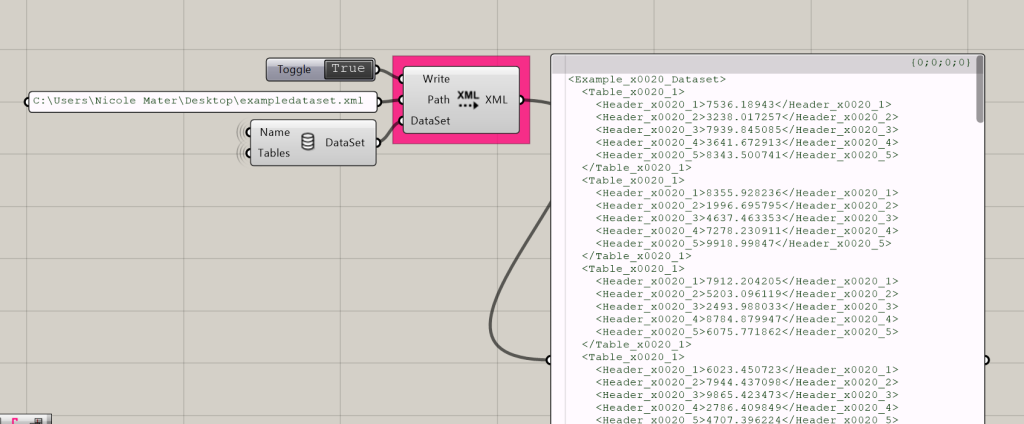
Create XML
Allows users to export a DataSet as an XML file.
Input:
- A boolean toggle to execute the write function
- A file path with the extension .xml, where the file will be written. Tip: the Grasshopper “File Path” component can be used.
- A DataSet
After executing the function, verify the XML file has been created at the specified destination
Note: If the boolean toggle is set to “True” and any changes are made to the grasshopper definition, the file will be overwritten. It is best practice to reset the toggle to “False” after creating file to avoid issues.
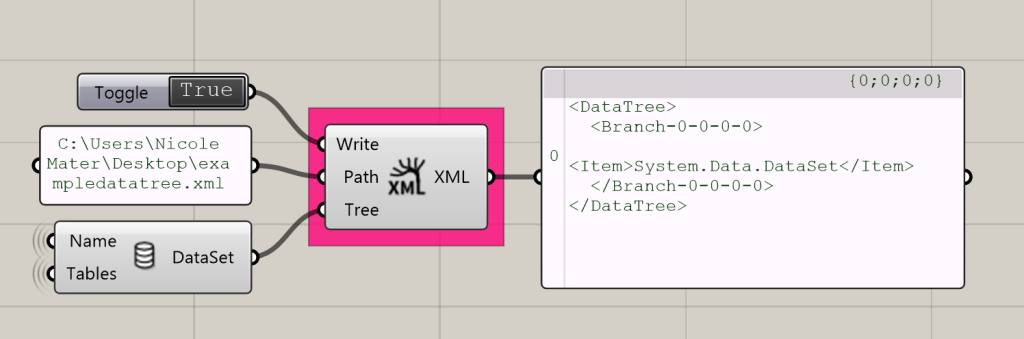
Create XML (Data Tree)
There are two components called “Create XML”. This one allows users to export the DataTree structure of a dataset as an XML file. The tree-like icon indicates this component is intended to be used for DataTrees rather than Data Sets. The input values also reflect the difference.
Input:
- A boolean toggle to execute the write function
- A file path with the extension .xml, where the file will be written. Tip: the Grasshopper “File Path” component can be used.
- A dataset
Returns: A DataTree definition written as an XML file.
After executing the function, verify the XML file has been created at the specified destination.
Note: If the boolean toggle is set to “True” and any changes are made to the grasshopper definition, the file will be overwritten. It is best practice to reset the toggle to “False” after creating file to avoid issues.
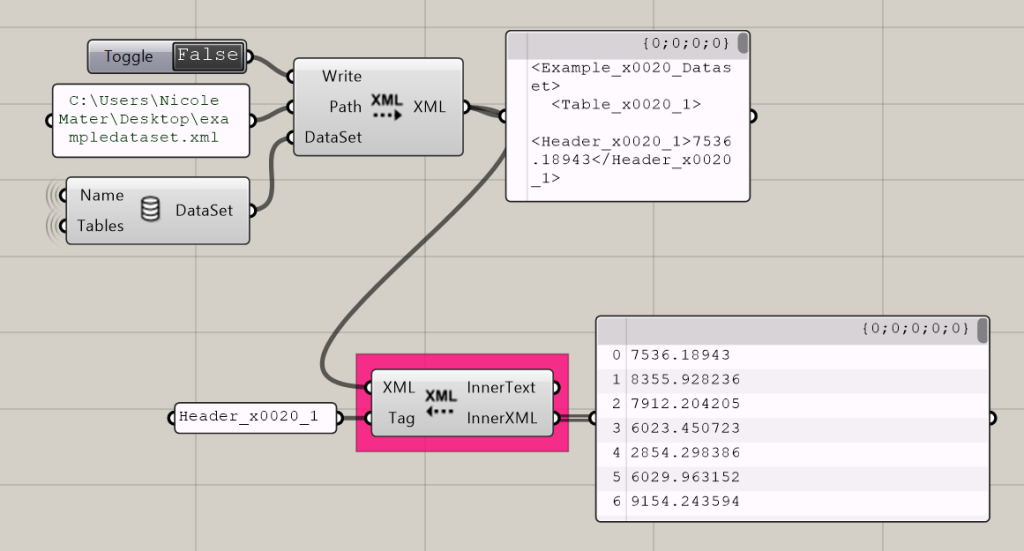
Read XML by Tag
Allows users to read XML data by tag.
Learn more about XML tags here (outbound link).
Input:
- An XML
- A tag, or list of tags
Returns: The values associated with the given tags from the specified dataset
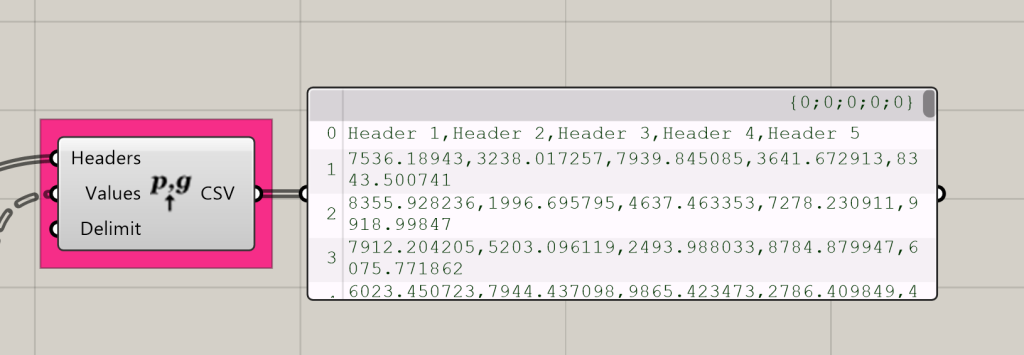
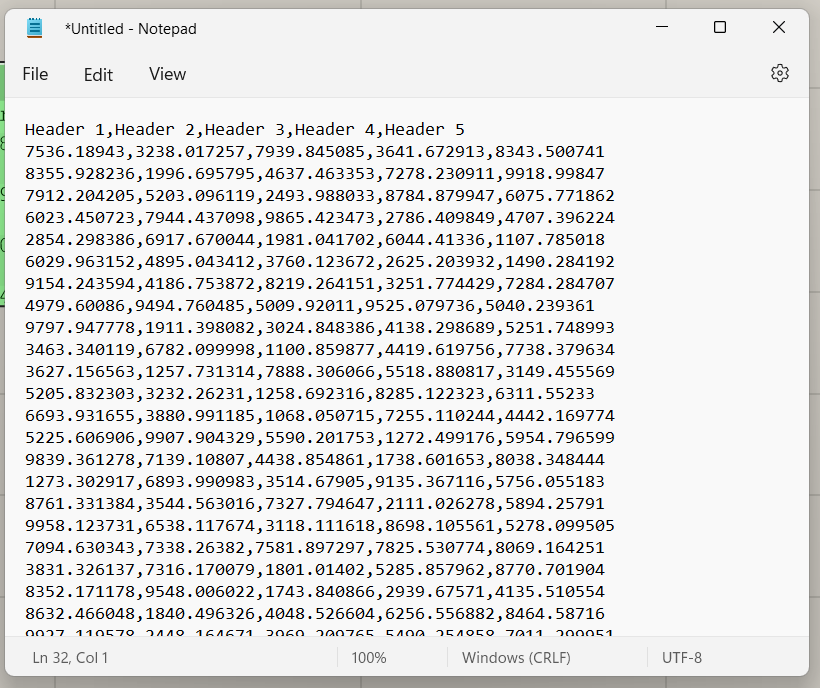
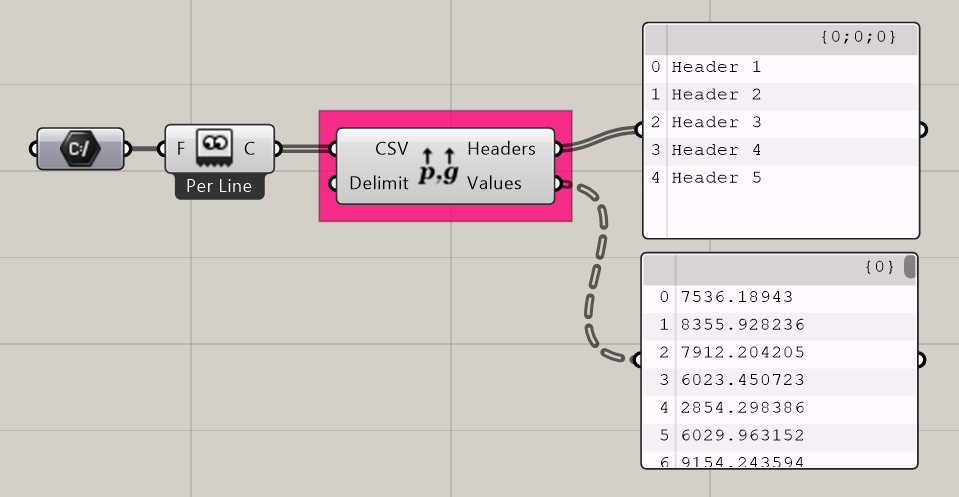
Create CSV
Allows users to create a CSV (which stands for Comma Separated Values) text-based list. CSV files are commonly used to transfer data between programs.
Input:
- A list of Headers. Tip: If using a panel, ensure that it is set to Multiline Data.
- A structured list of Values corresponding to the specified Headers.
- A delimiter, which will separate the values. The default is a comma. A text-based panel can be used to customize the delimiter.
Returns: Text in a CSV format.
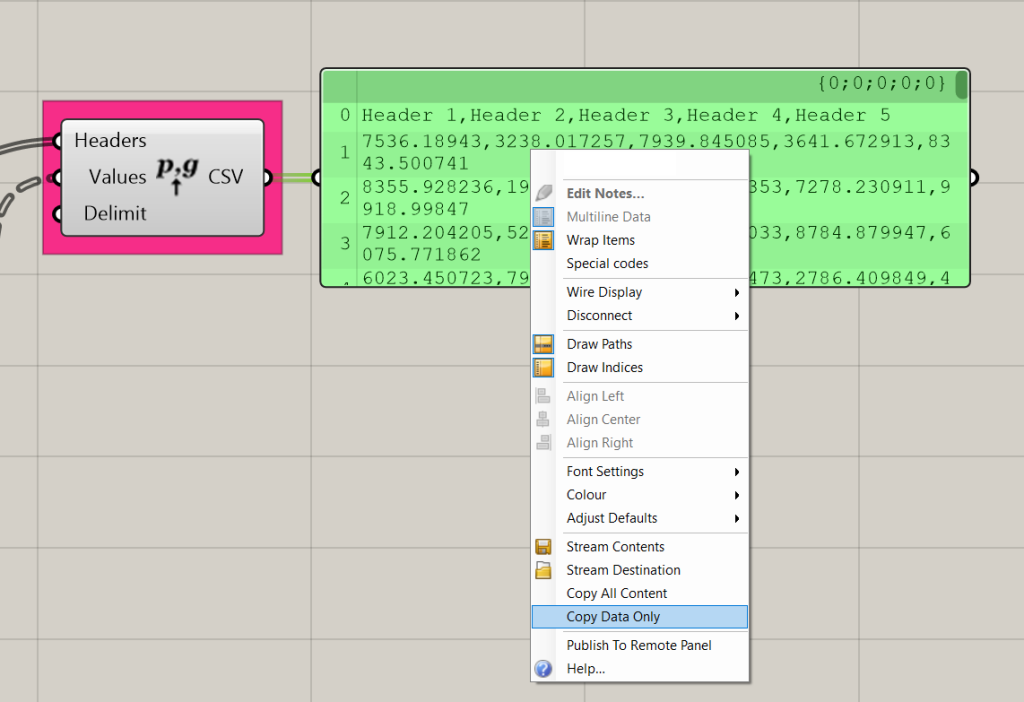
To save the resulting CSV as a .csv file,
- Right click on the text panel
- Select “Copy Data Only”
- Open a Notepad
- Paste the data
- Save the Notepad’s text file as a .csv (example: “filename.csv”)
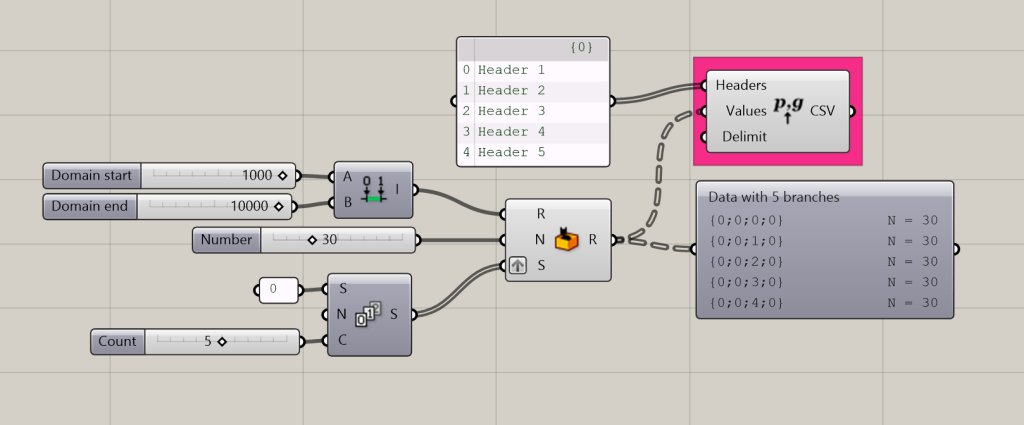
In this example, a list of random integers are given as values.
Read CSV
Allows users to read the contents of a CSV, separating the headers from the values.
Input:
- The contents of a CSV in a text-based format.
- The delimiter used in the CSV. The default delimiter is a comma.
Returns: The headers and values from the CSV file, separated into their respective lists.
In this example, we used a “File Path” component to specify a CSV, and a “Read file” component to return its contents in a text based format.
Convert JSON to XML
Allows users to convert XML files to JSON files.
Input:
- A JSON string. In the example to the right, we are using a file path component to specify an XML file and a Read File component to read the file contents.
Returns: The data from the JSON, reformatted as an XML.
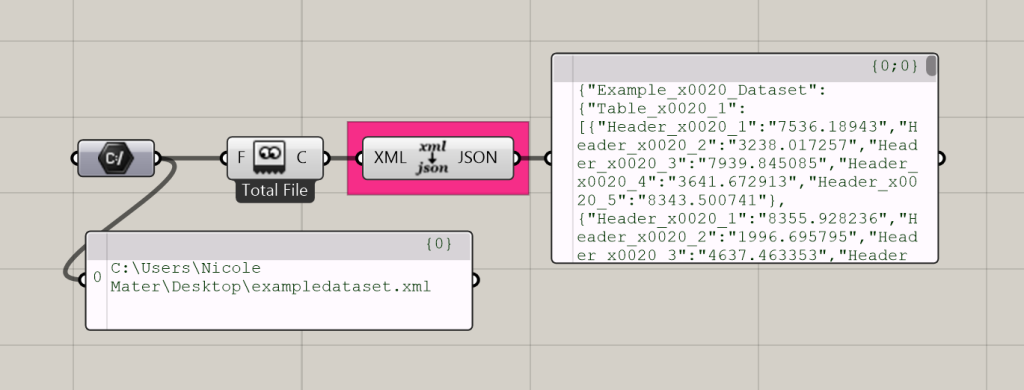
Convert XML to JSON
Allows users to convert XML files to JSON files.
Input:
- An XML string. In the example to the right, we are using a file path component to specify an XML file and a Read File component to read the file contents.
Returns: The data from the XML, reformatted as a JSON
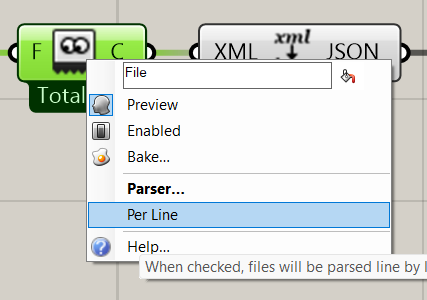
Tip: Ensure the “Read File” component is set to Total File and not “Per Line”. Right click on the component and select “Per Line” to toggle modes.
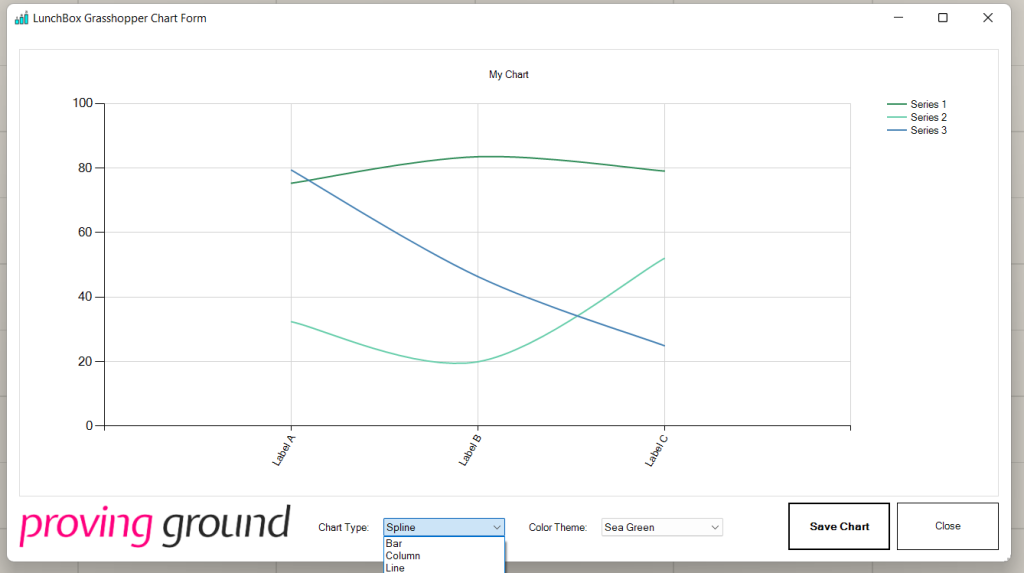
Create Chart
Allows users to create a WinForm chart and save it as a JPEG.
Learn more about WinForm charts here (outbound link).
Input:
- A chart name, as text
- A list of Series names
- A list of X-Axis labels
- A structured list of Values, corresponding to the specified X-axis labels and Series.
Returns: List of Property Fields.
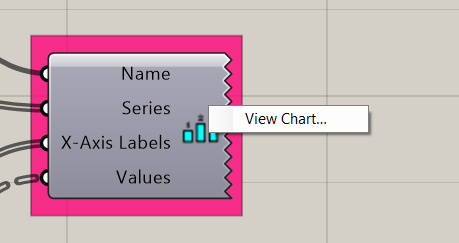
To use:
- Input the variables to the component
- Right click on the component icon. A menu with the option to “View Chart…” should appear.
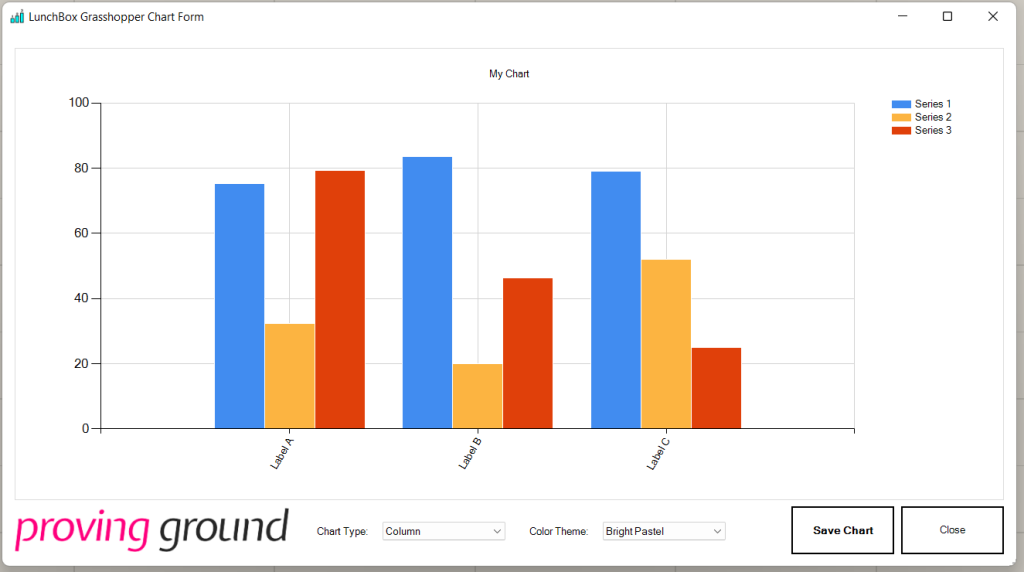
- Select “View Chart…”. A window with a chart will open.
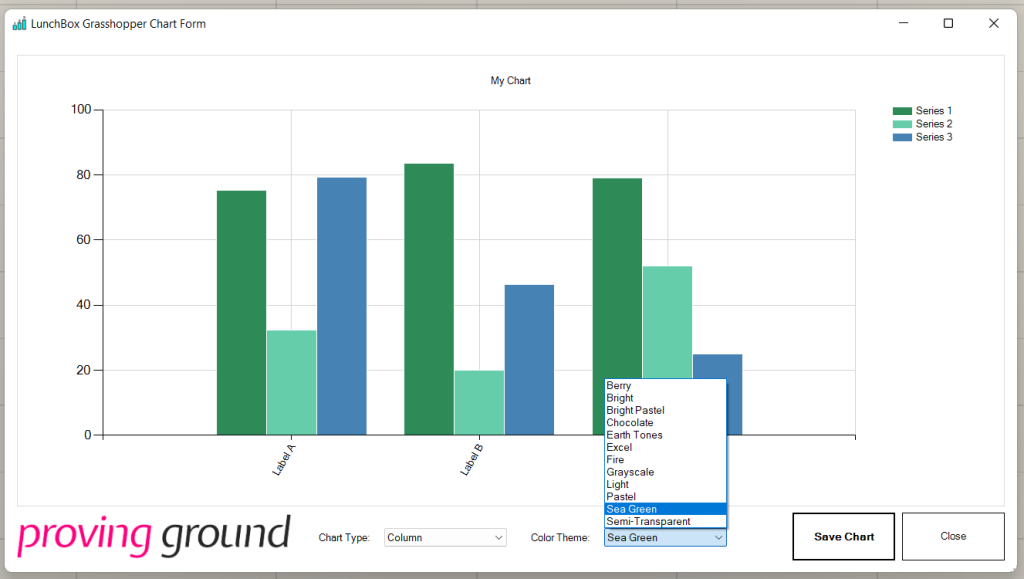
- The chart type and color scheme can be edited by selecting an option in each of the drop down menus at the bottom of the window.
- Select the “Save Chart” button. A file browser window will open.
- Specify the file location and name, then hit Save. A JPEG of the chart will be saved.
- Select “Close” to close out of the WinForm chart editor window and return to Grasshopper.
Supported Chart Types:
- Bar
- Column
- Line
- Point
- Spline
- Stacked Area
- Stacked Column
- Stacked Bar
- Step Line
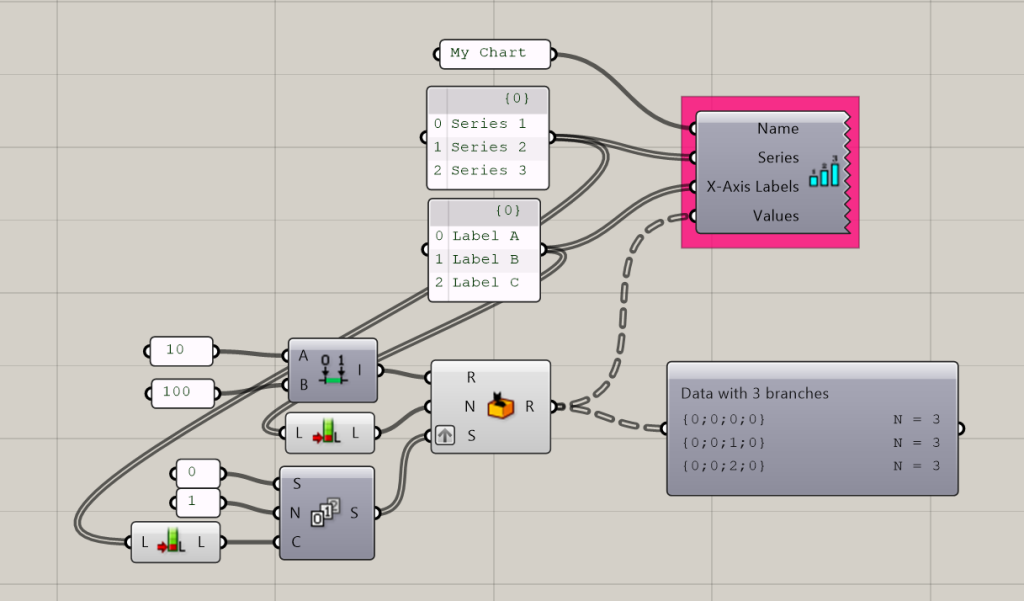
To illustrate the component, random integers are used as Values.
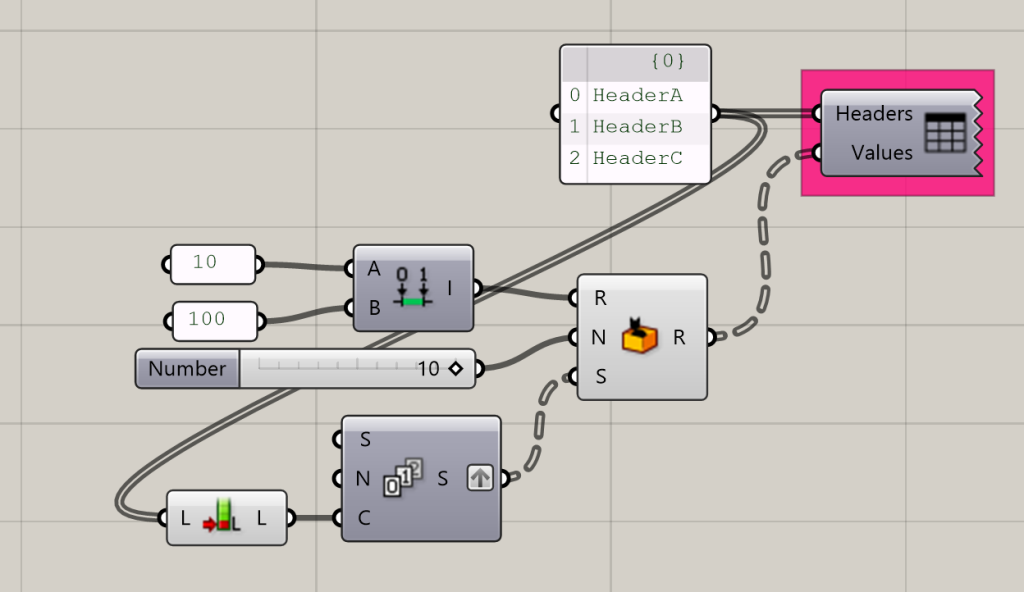
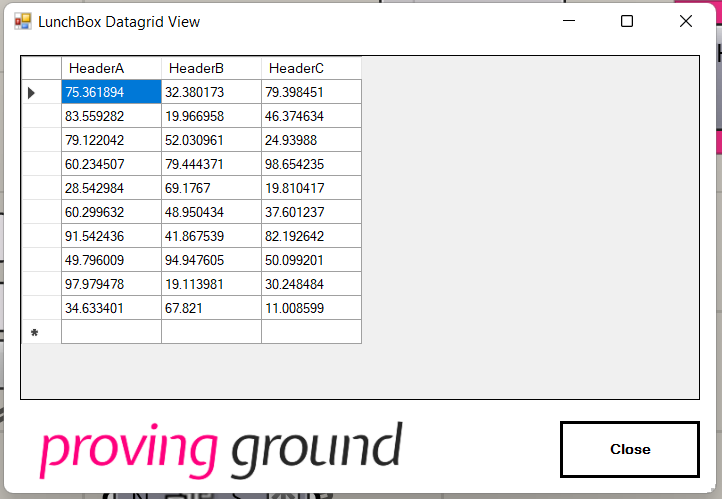
Create Data Grid
Allows users create and view their data in a Grid format, like a spreadsheet.
Input:
- A list of Header Names
- A tree of numeric Values, where each branch corresponds to a header in the specified order.
To use:
- Input the required variables
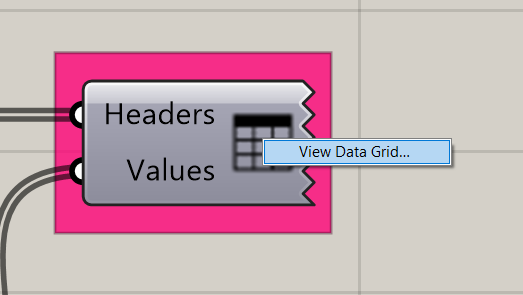
- Right click on the component icon. A menu containing “View Data Grid” should appear.
- Select “View Data Grid”. The LunchBox DataGrid View window should appear.
- If desired, Values can be copied (Select and CTRL+C) and pasted (CTRL+V) to a Notebook or empty spreadsheet to create a CSV.
- Select close to return to Grasshopper.