Summary
The standard version of Semantic includes a 3D Rhino model visual for Power BI. The visual allows users to build dashboards with 3D Rhino geometry and Semantic data.
Setting up a 3D Rhino Visual
1. Load the Rhino visual into your Power BI Report
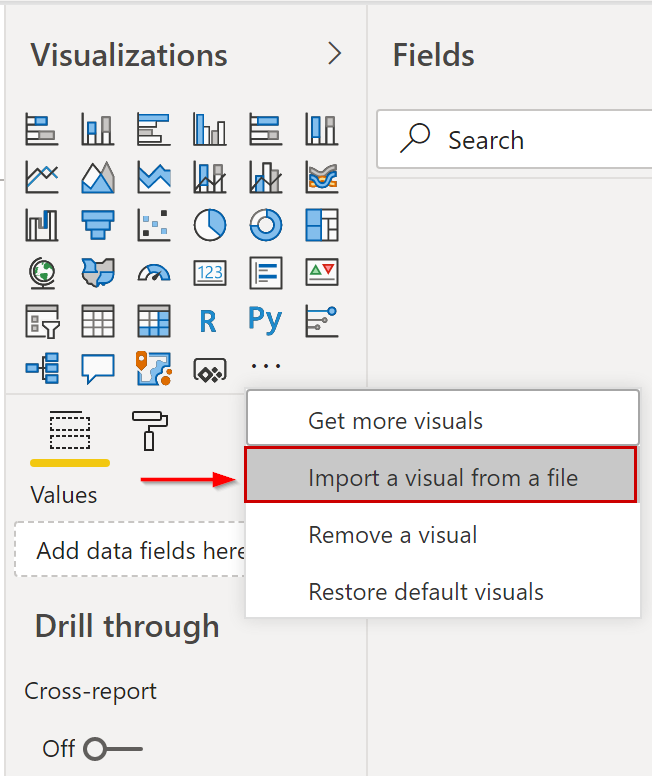
In Power BI, navigate to the Visualization menu. Select “Import Visual from File”
Navigate to and select the Rhino.pbiviz file that is installed with the standalone Semantic 1.0 install.
2. Upload a Rhino model
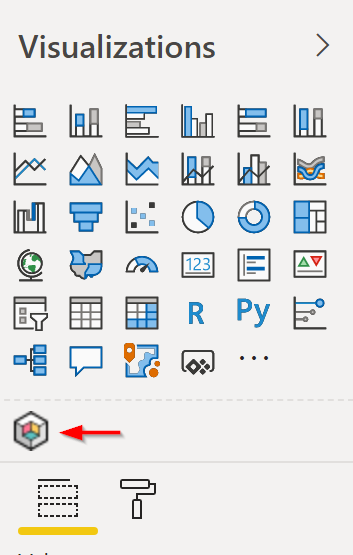
Create an instance of the visual within your Power BI report.
Click the “Upload” button and navigate to a Rhino 3DM file.
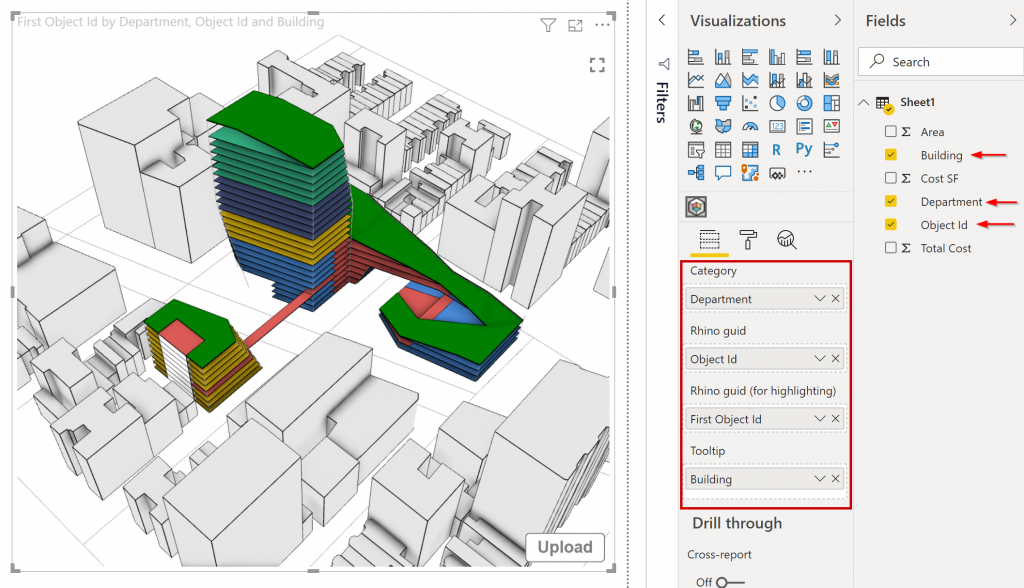
3. Connect the visual to field data
Add data fields to the visual.
Note: Power BI visuals require that data be added to the fields for the 3D data to display.
4. Navigate the 3D Visual
Pan and zoom in the visual using 3D controls:
- Right-click to rotate
- Mouse-wheel to zoom
- Left-click to pan and select