Summary
Just Getting Started?
Download the Tracer sample Power BI template package!
Note: Templates contain “watermarked” trial versions of the visuals.
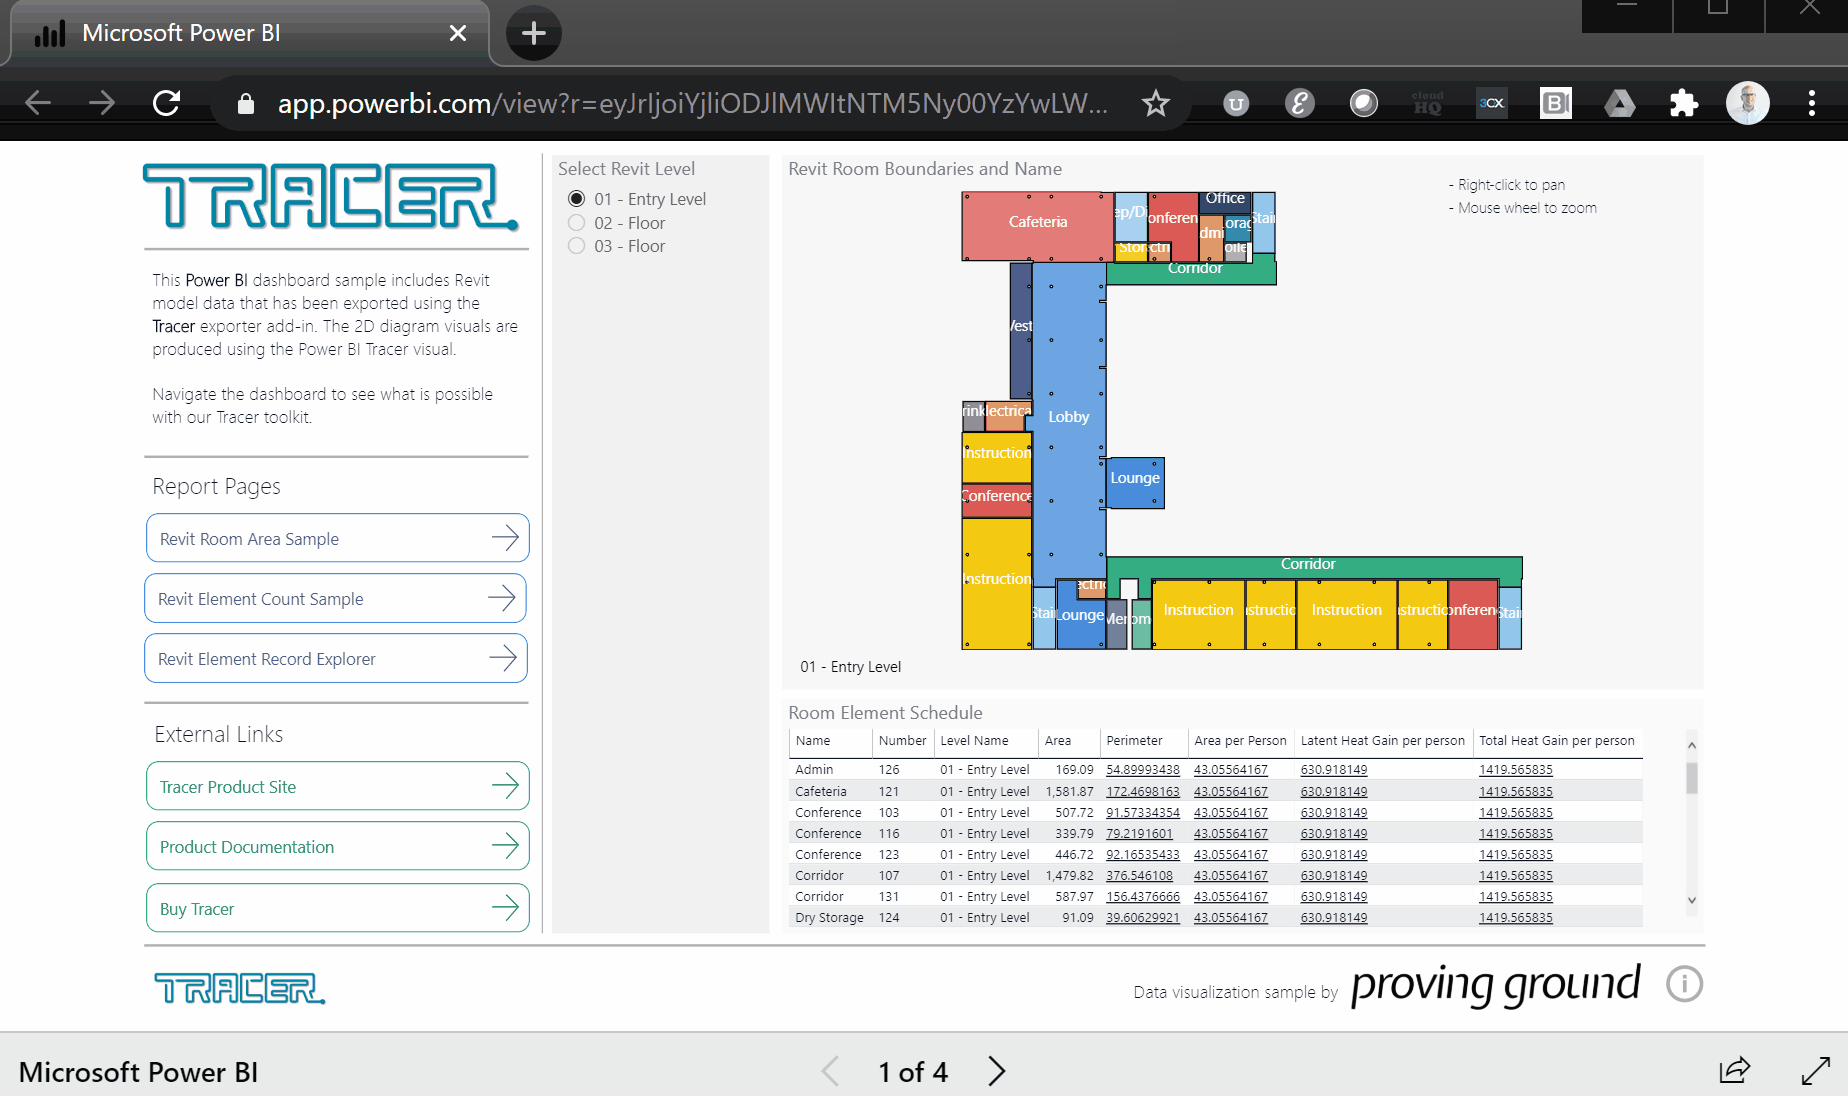
Revit Data Report
This dashboard shows different data included in a Tracer Revit export and provides the ability to test the Power BI Tracer visual.
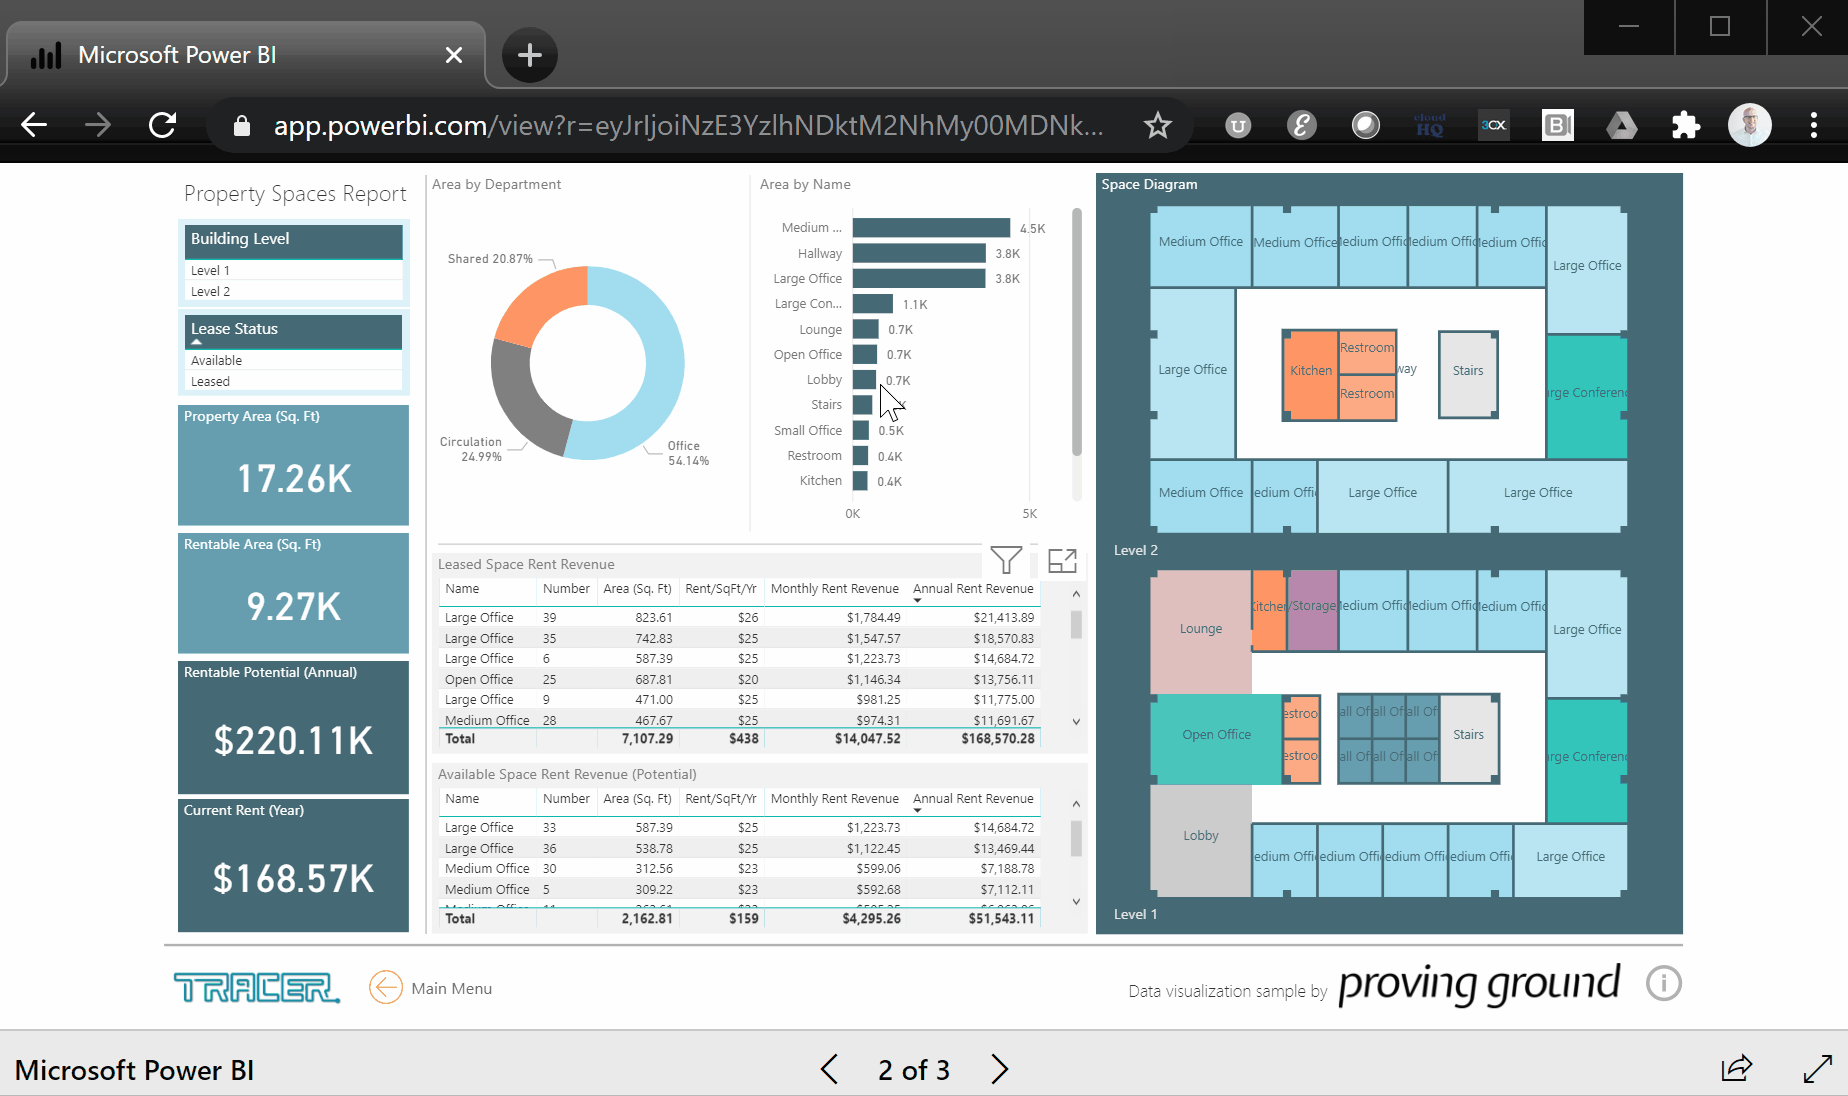
Property Spaces and Occupancy Report
This dashboard demonstrates using Revit office room data exported from Tracer to understand a building’s commercial space uses, revenue potential, and occupancy.
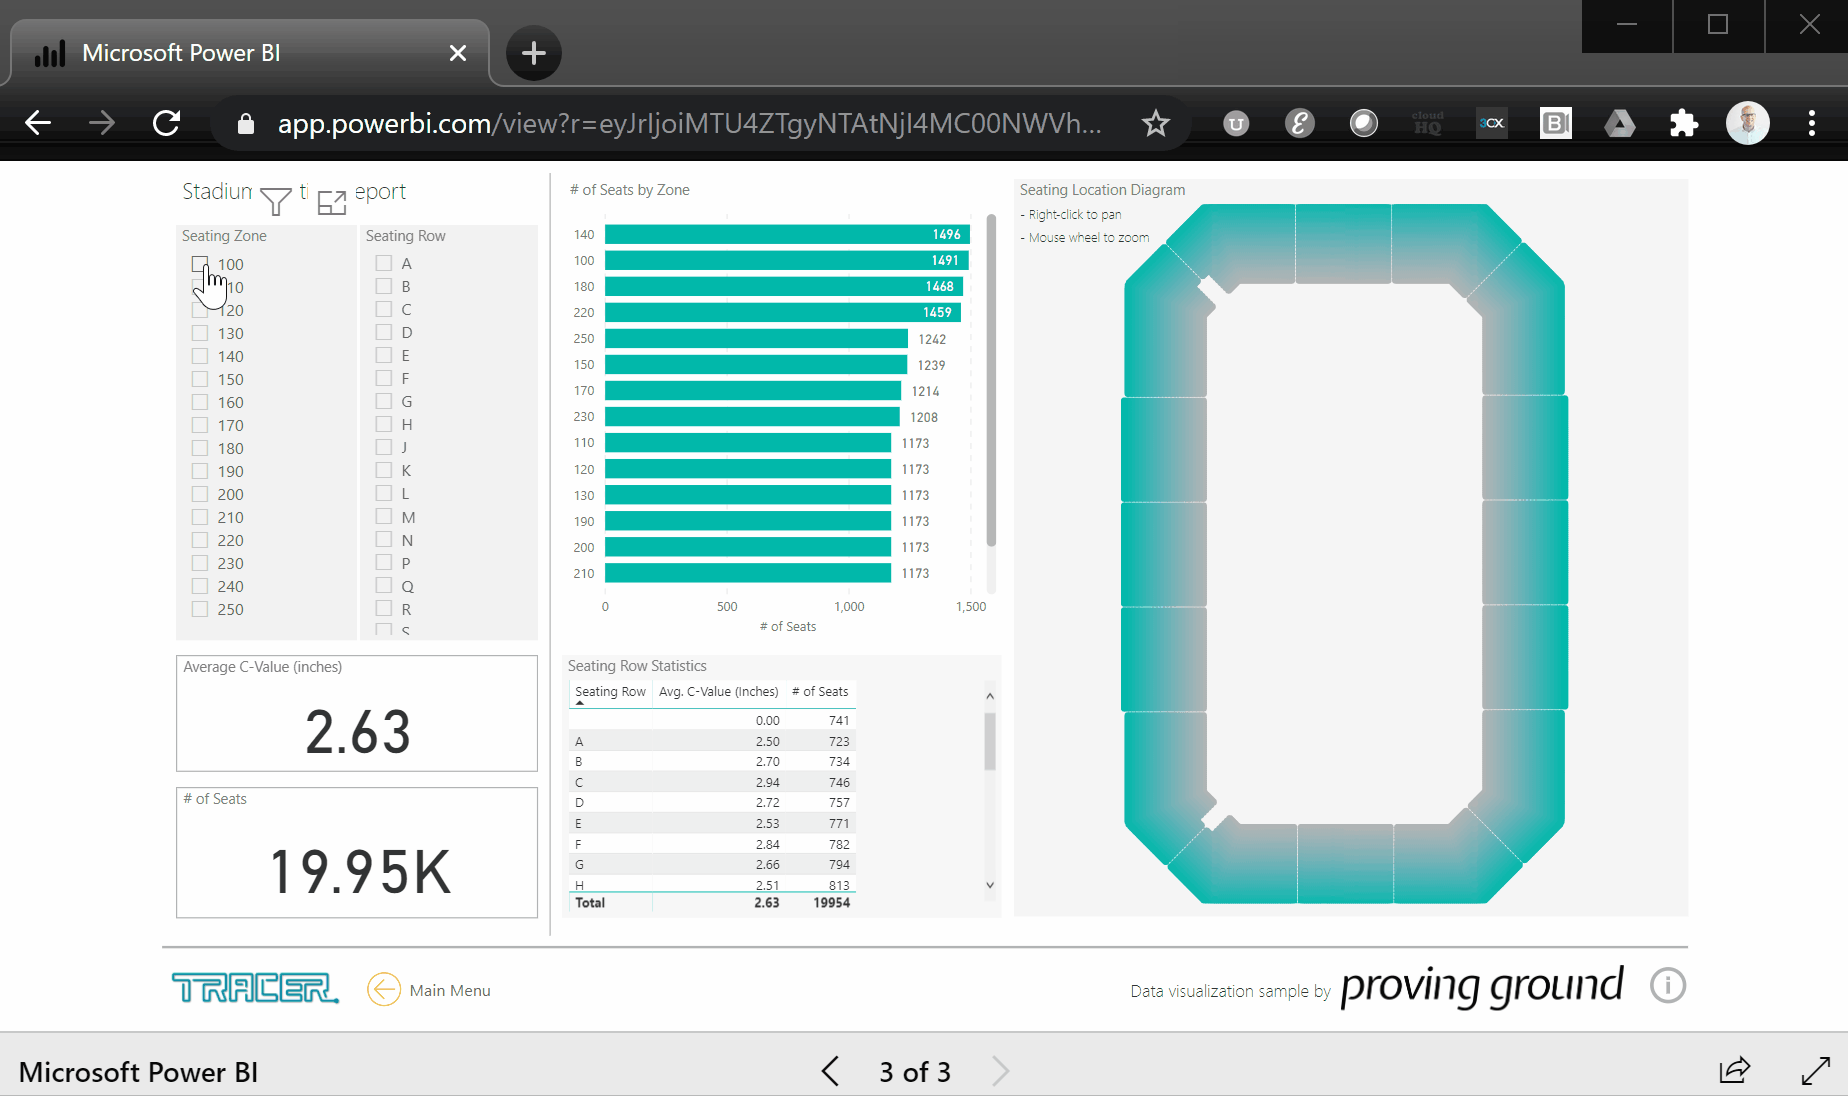
Stadium Design Report
This dashboard demonstrates visualizing a conceptual stadium design including areas and seating layout data.
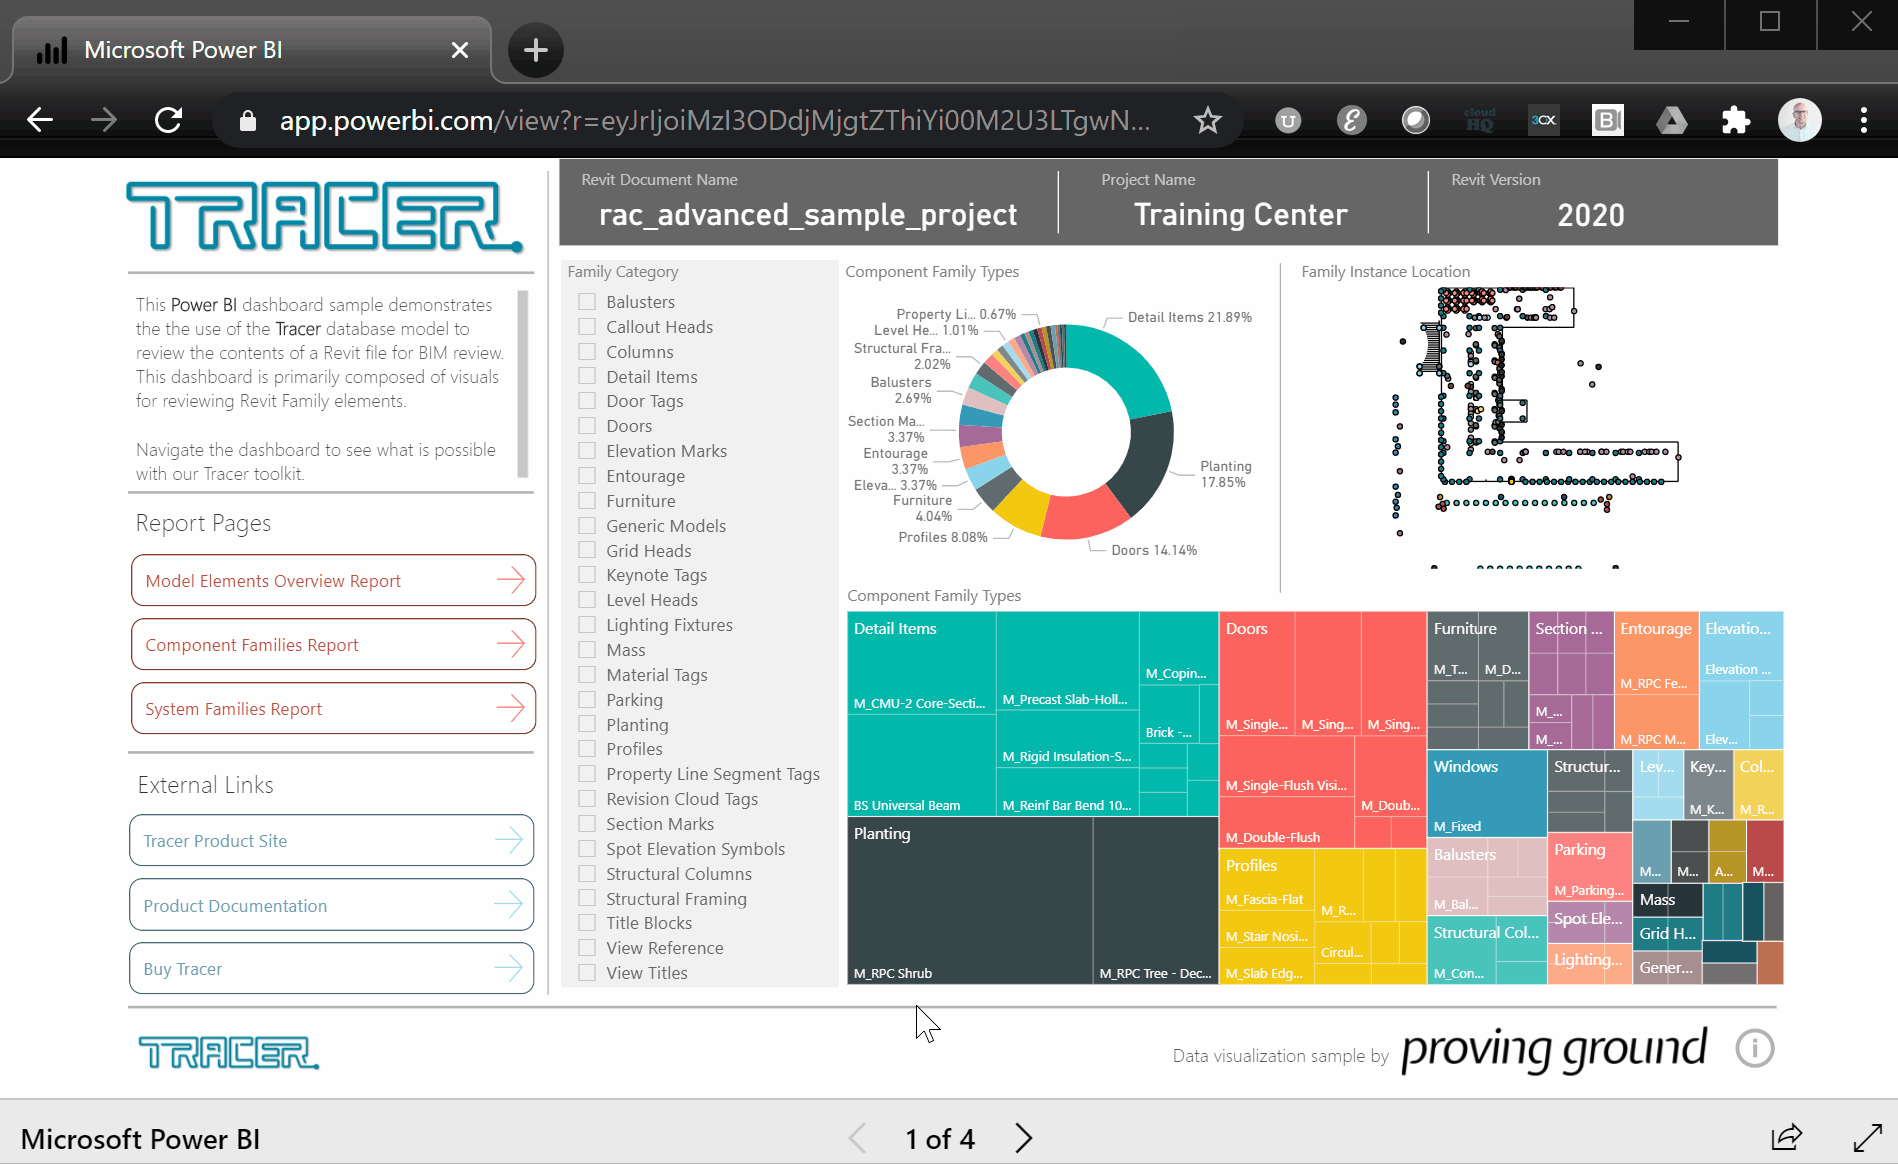
BIM Content Report
This dashboard demonstrates reporting opportunities for BIM content using the Tracer database export for Revit. The report provides Family usage stats and quantities in a model and more.