1. Add a Conditional Column
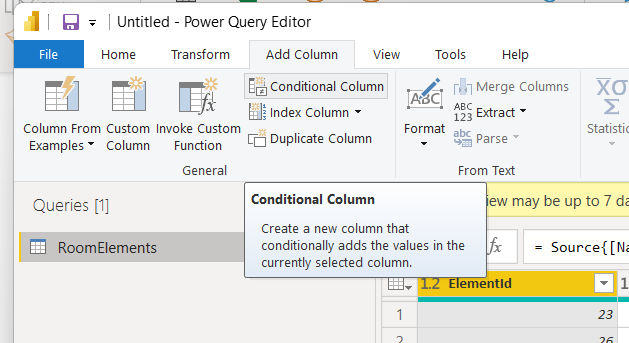
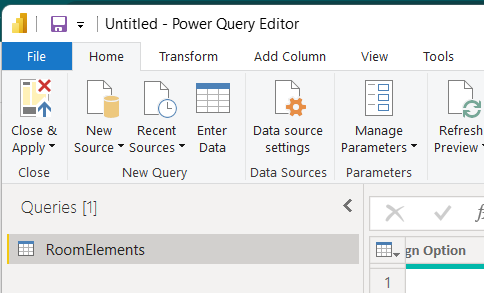
In Power BI’s ribbon window, select Transform Data.
The Transform Data window will pop up. From the top menu, select the Add Column tab. Then select “Conditional Column”
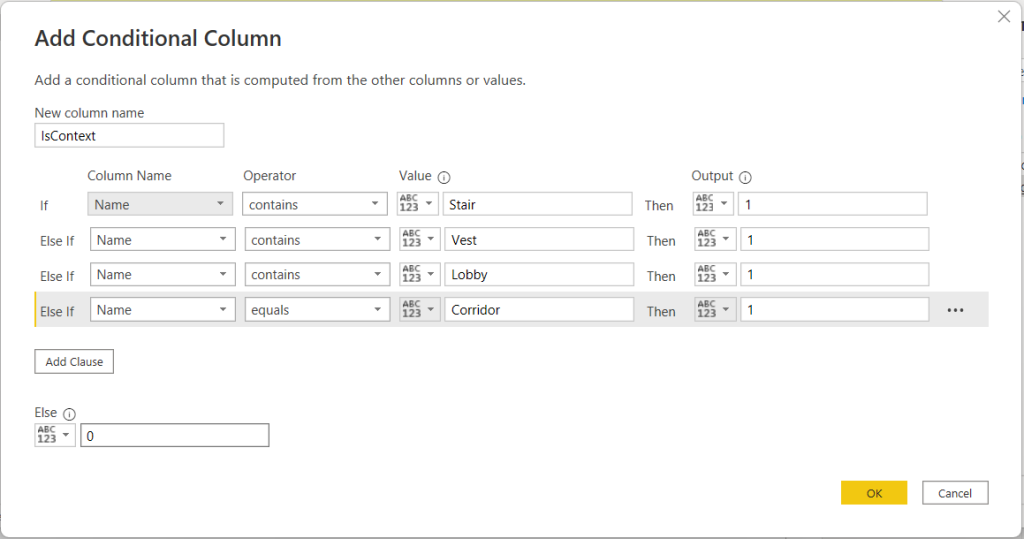
A window will open to define the column. Enter a name for the column, and then use the field options below to identify the data that you wish to be identified as context. Give each line that will be identified as context a “1” for True. Set the Else field, at the bottom of the window, to “0” for False. Then hit OK.
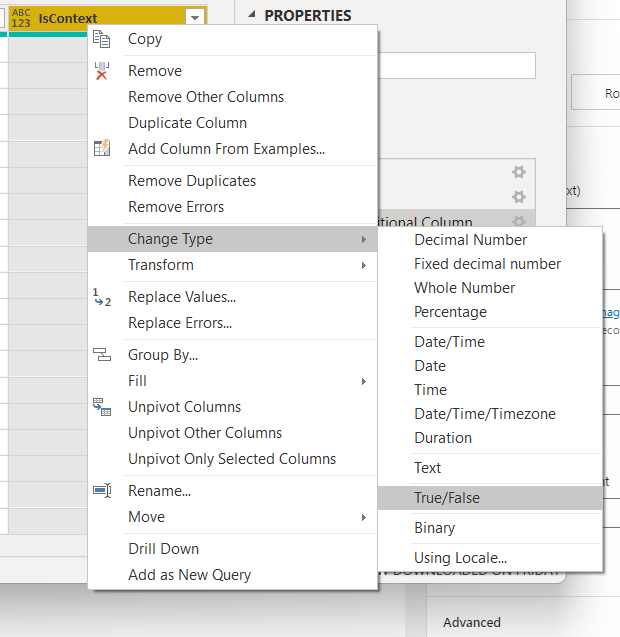
2. Change Type to True False
Right click on the name of the conditional column, and Change Type to True/False.
In the Transform Data top menu, select Home. Then click Close and Apply. This will close the Transform Data window and the the data will reload into the report.
3. Add the conditional column to the Context field of the visual
Navigate to the column in the fields panel, then drag and drop the conditional column into the Context area of the Tracer 2D visual. The visual will update to reflect the changes.
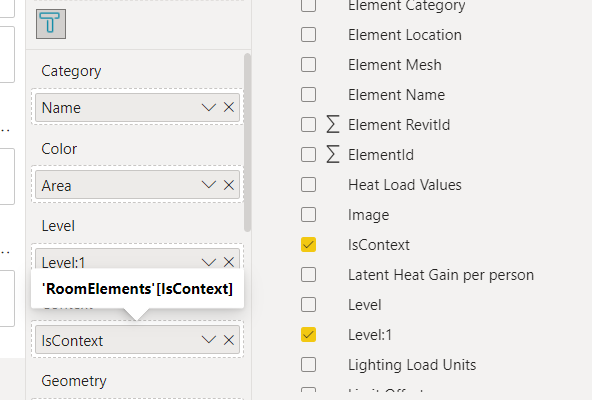
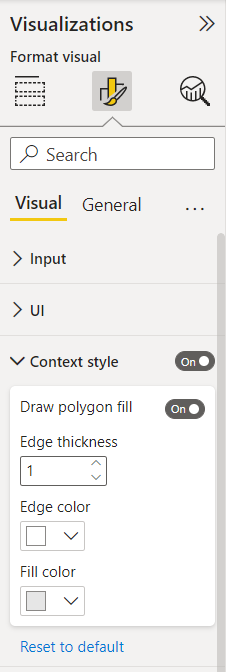
4. Format Context Appearance
In the Format Visual tab, expand the Context menu and adjust the settings to adjust the visual’s appearance. Lineweight, fill, and colors can be set. Context can also be toggled on and off, which will hide any objects flagged as context from the visual.