1. Create a color legend table and connect to Power BI
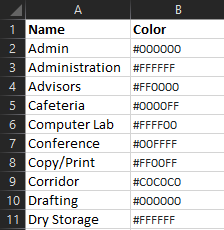
Using Excel or other similar data source, you can compose a basic table that will key a data value to a corresponding color.
Here is an example of a list of “Room names” corresponding to a color value (in hexadecimal format)
Connect your Power BI report to this table.
2. Create a relationship between the legend and table with geometry
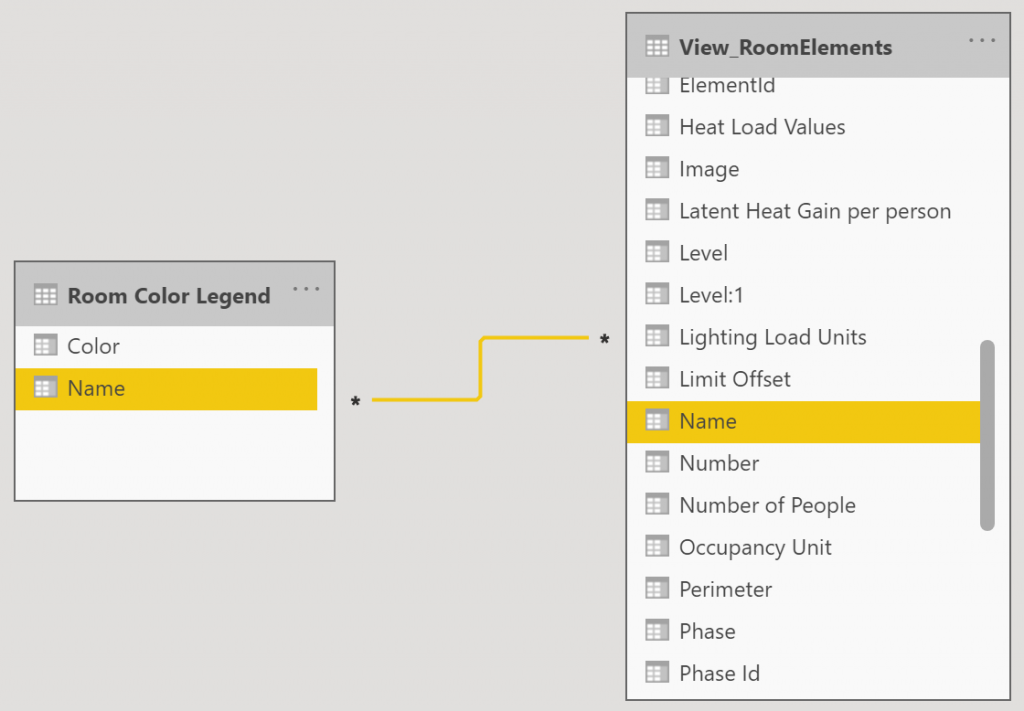
Use the Power BI relationship editor to join the color legend your related data set.
This example shows joining the Name field from the legend table to the Name filed in an Room elements listing.
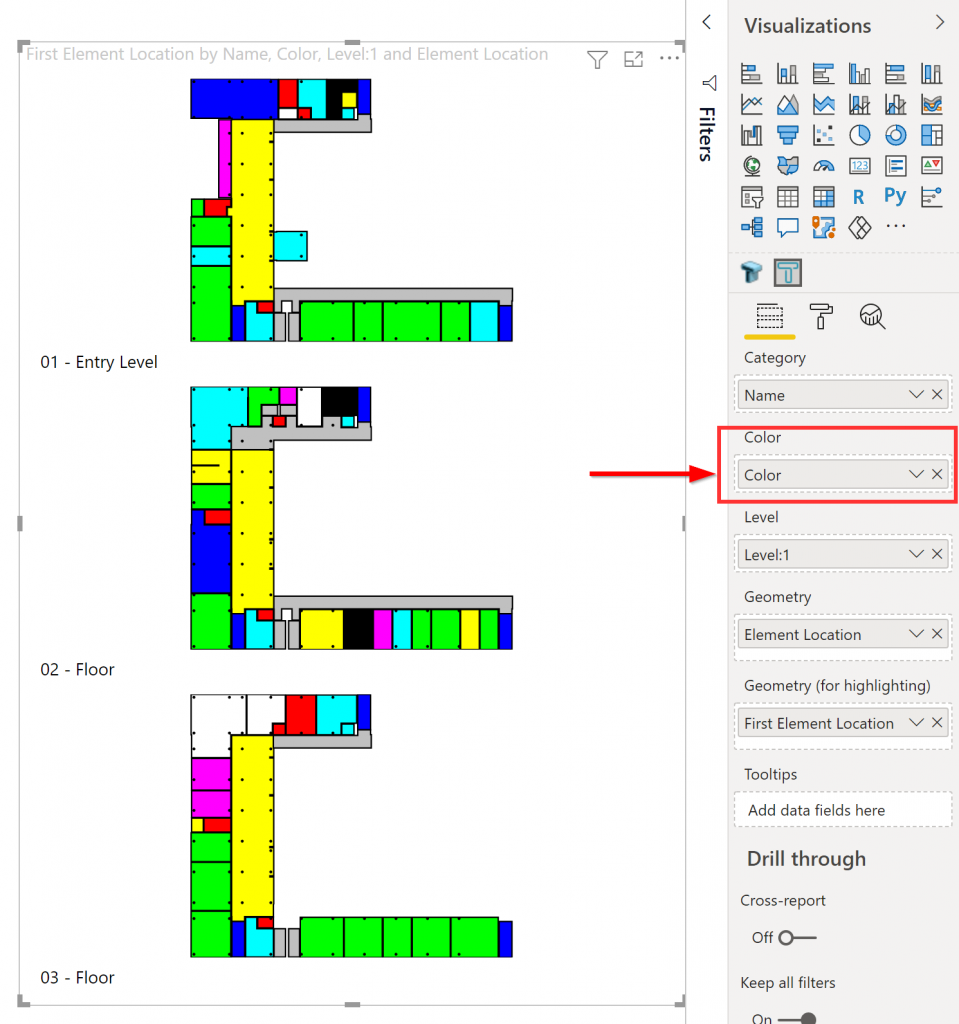
3. Assign the Color value to the visual’s color field
Select the 2D or 3D Tracer visual in the Report editor and assign the “Color” field.
The color values will become assigned to their related elements in the view.