Supported Version: Tracer V3
Summary
The Tracer V3 3D Visual supports conditional formatting for model elements. It can be set up within the Data Styles menu under the Format Style tab.
Steps
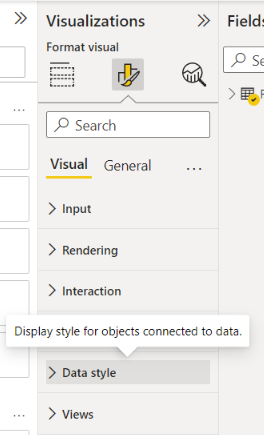
1. Expand the Data Style Menu.
When selected on a Tracer 3D visual, navigate to the Data Style area under the Format Style Tab.
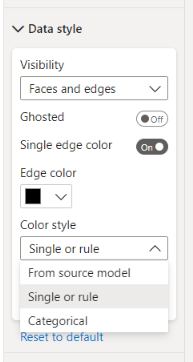
2. Select “Single or Rule”
In the Color Styles drop down menu, change the type to Single or Rule.
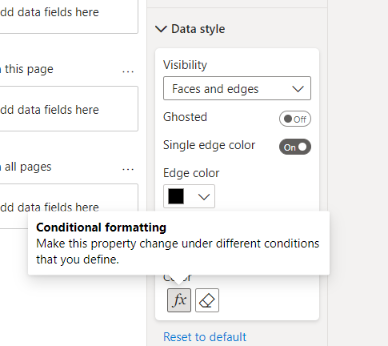
3. Select the Function button (fx).
4. Select a style.
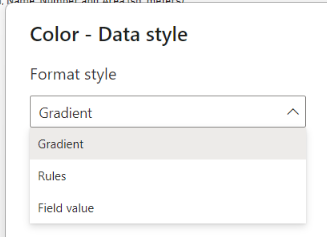
In the settings menu, select one of the options from the Format Style drop down menu
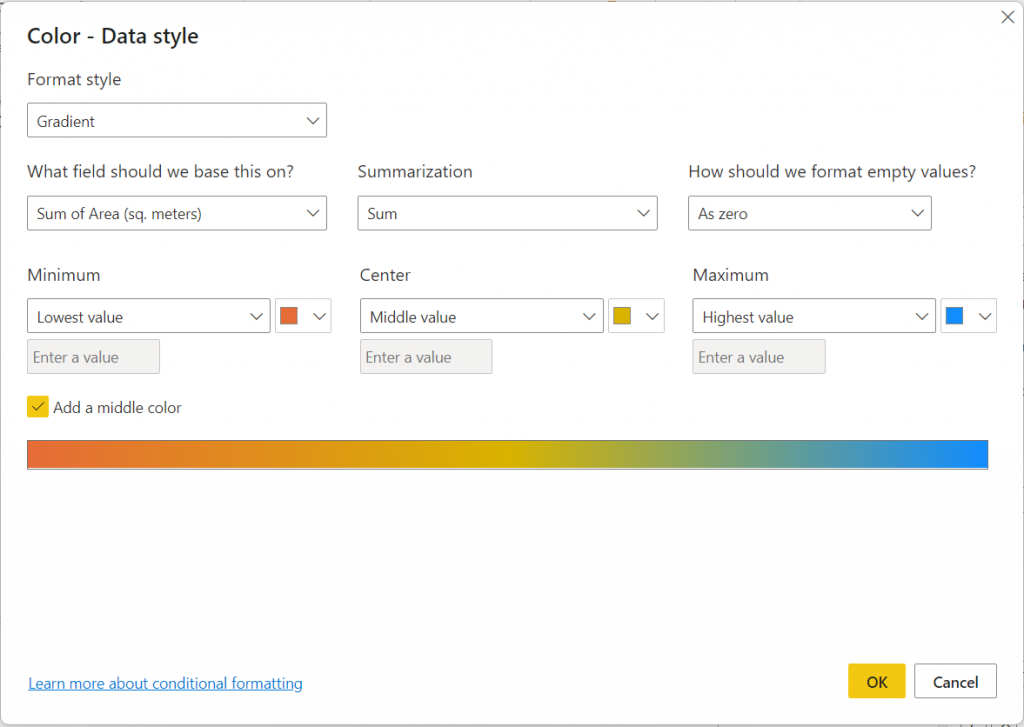
5. Gradient Style
Select a Field, such as area, and a summarization method, such as Sum. Select a method by which for format empty values (null data). Select a color for the minimum and maximum values. You have the option to add a middle color. You can also set specific values for the minimum, maximum, and minimum or use the Lowest, Highest, and Middle values.
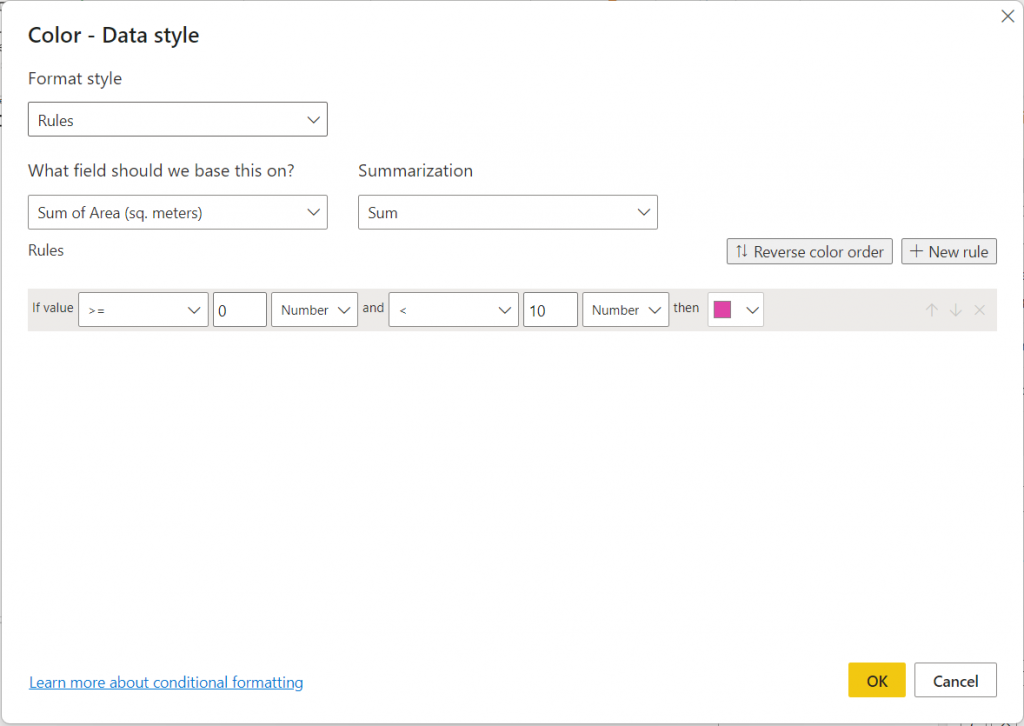
5 (Alternate). Rule-Based
Create a list of rules using functions to set domains of data to specific colors. Add rules to the list by selecting “New Rule”. Subtract rules from the list by hitting the X at the right end of each rule. Rearrange Rule order with the Up and Down Arrows.