Summary
Just Getting Started?
Download the Tracer sample Power BI template package!
Note: Templates contain “watermarked” trial versions of the visuals.
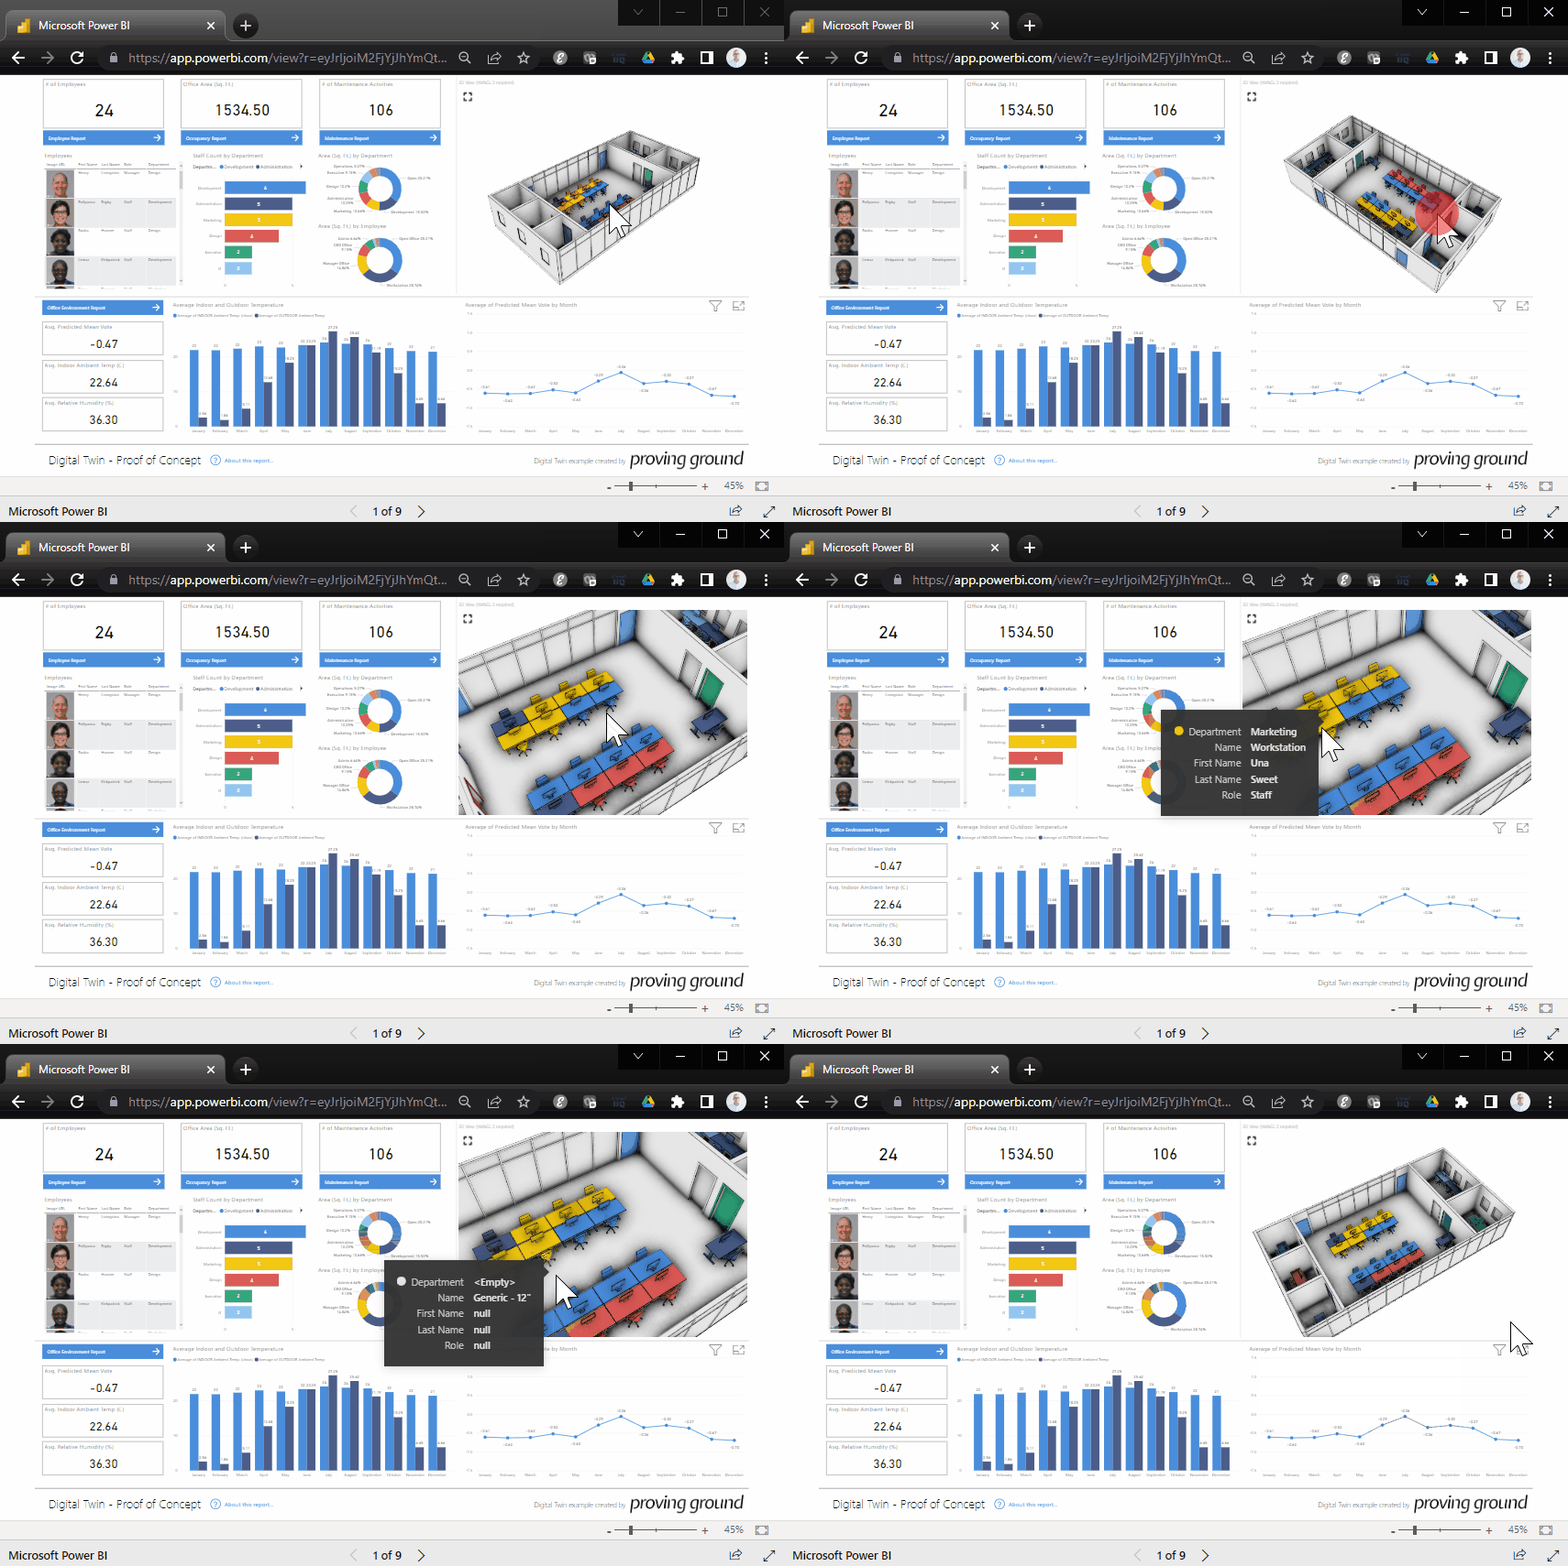
Digital Twin Concept
This Power BI report uses Revit data combined with available occupancy and environmental data to create a proof-of-concept for using Power BI as a digital twin interface.
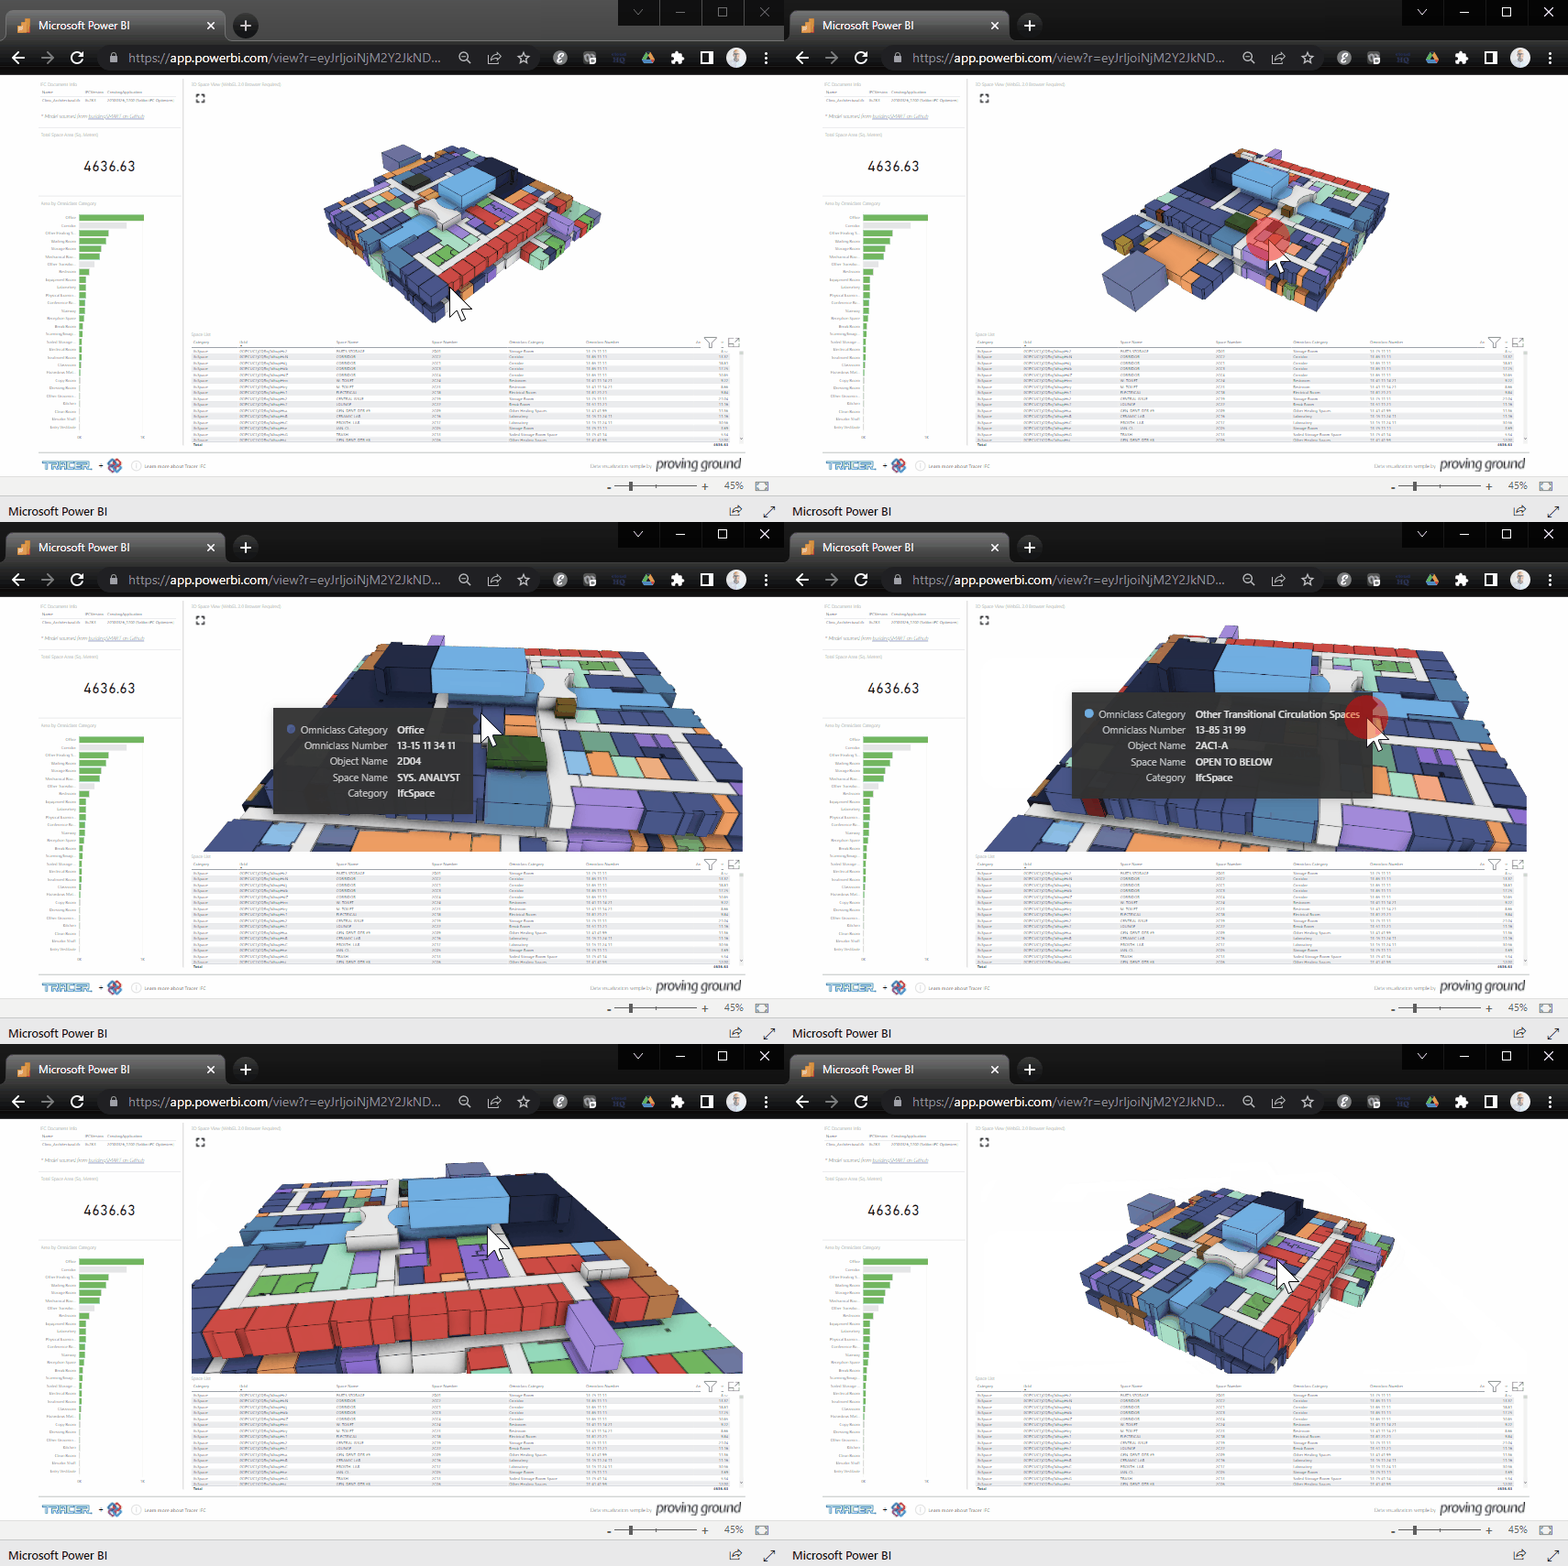
Planning Rooms and Spaces
This Power BI report uses 3D space element data to show opportunities for planning and program analysis of a building.
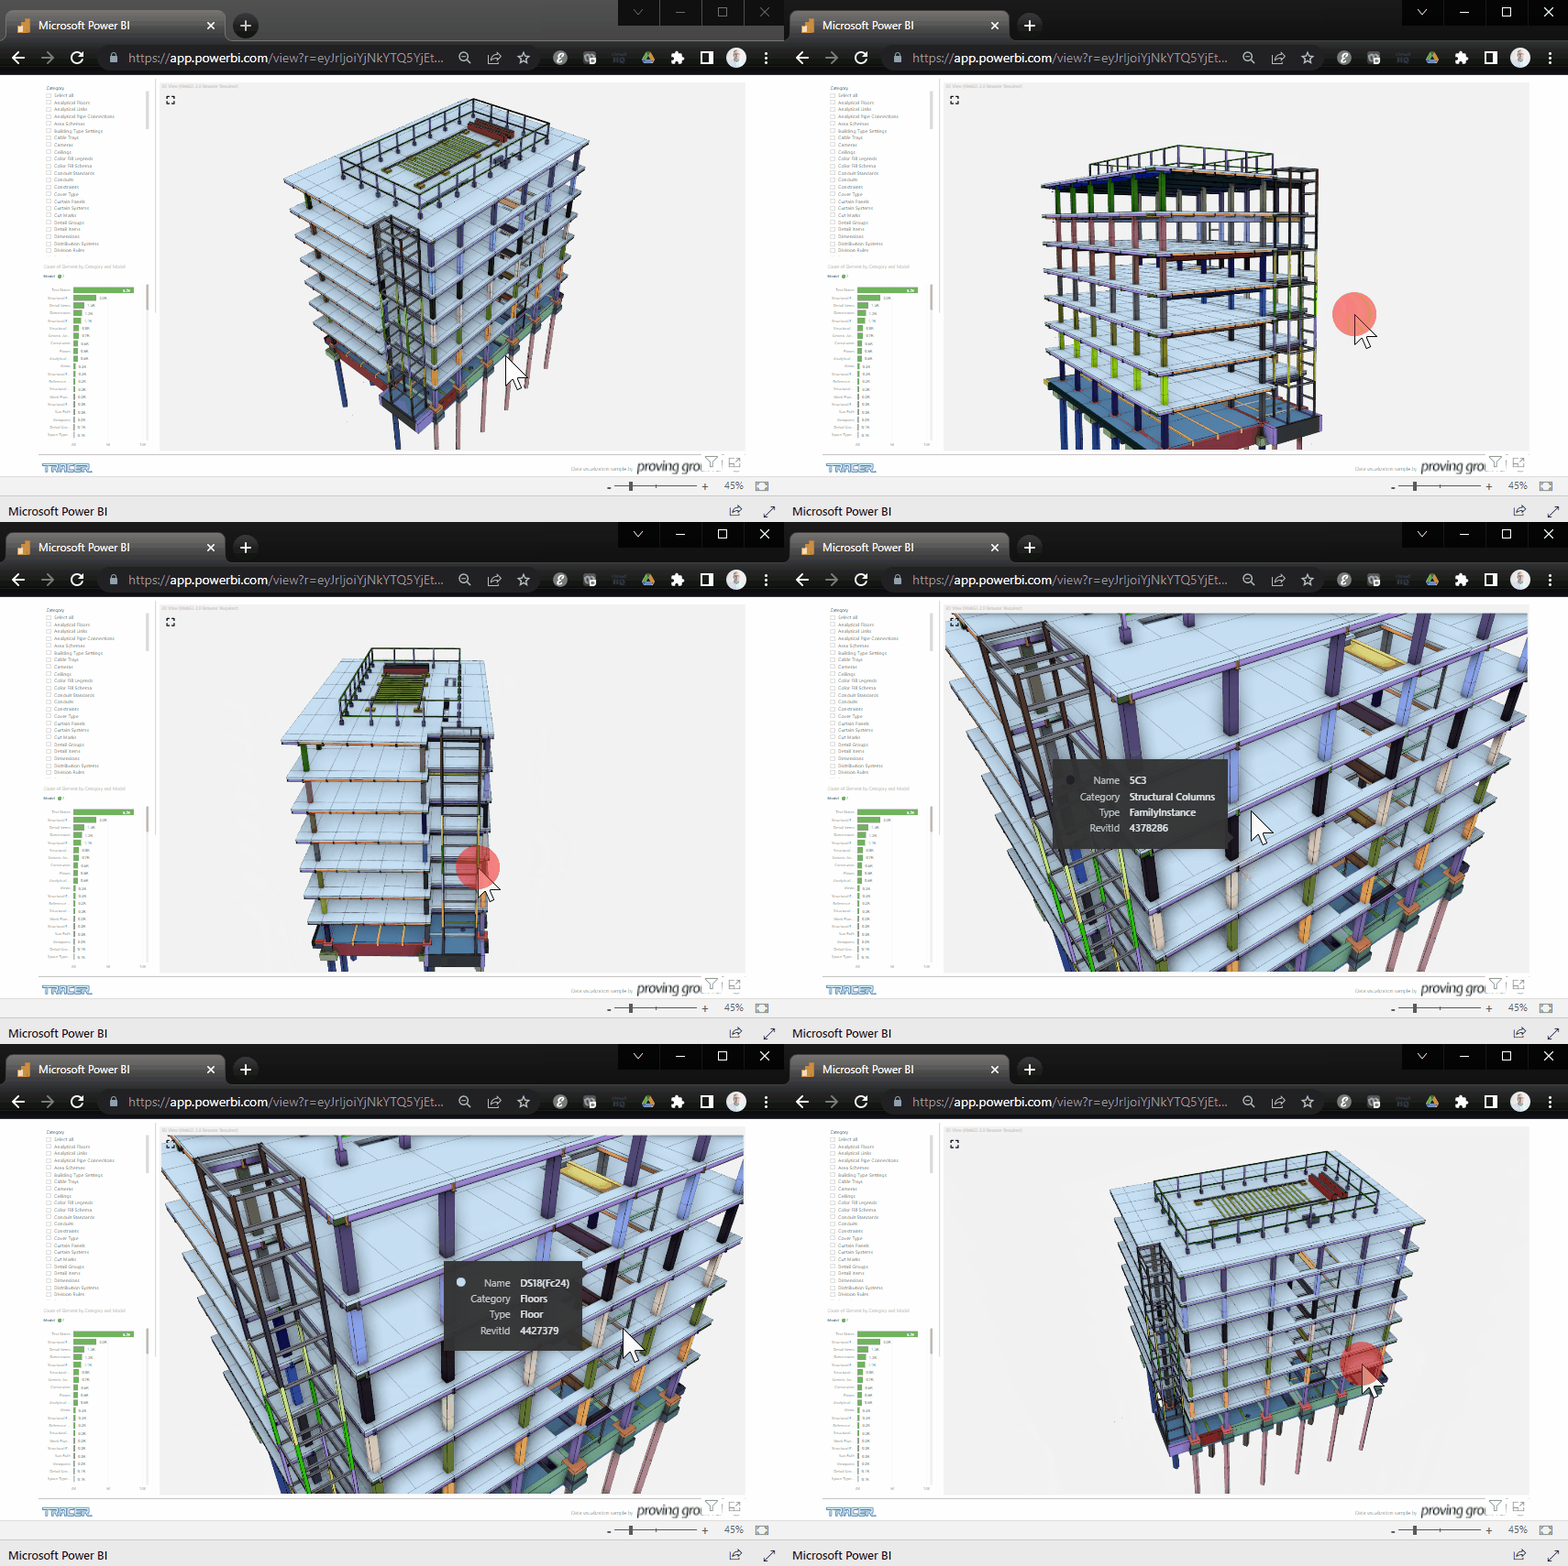
Structural Elements
This dashboard shows 3D Revit structural elements for use in coordination activities.
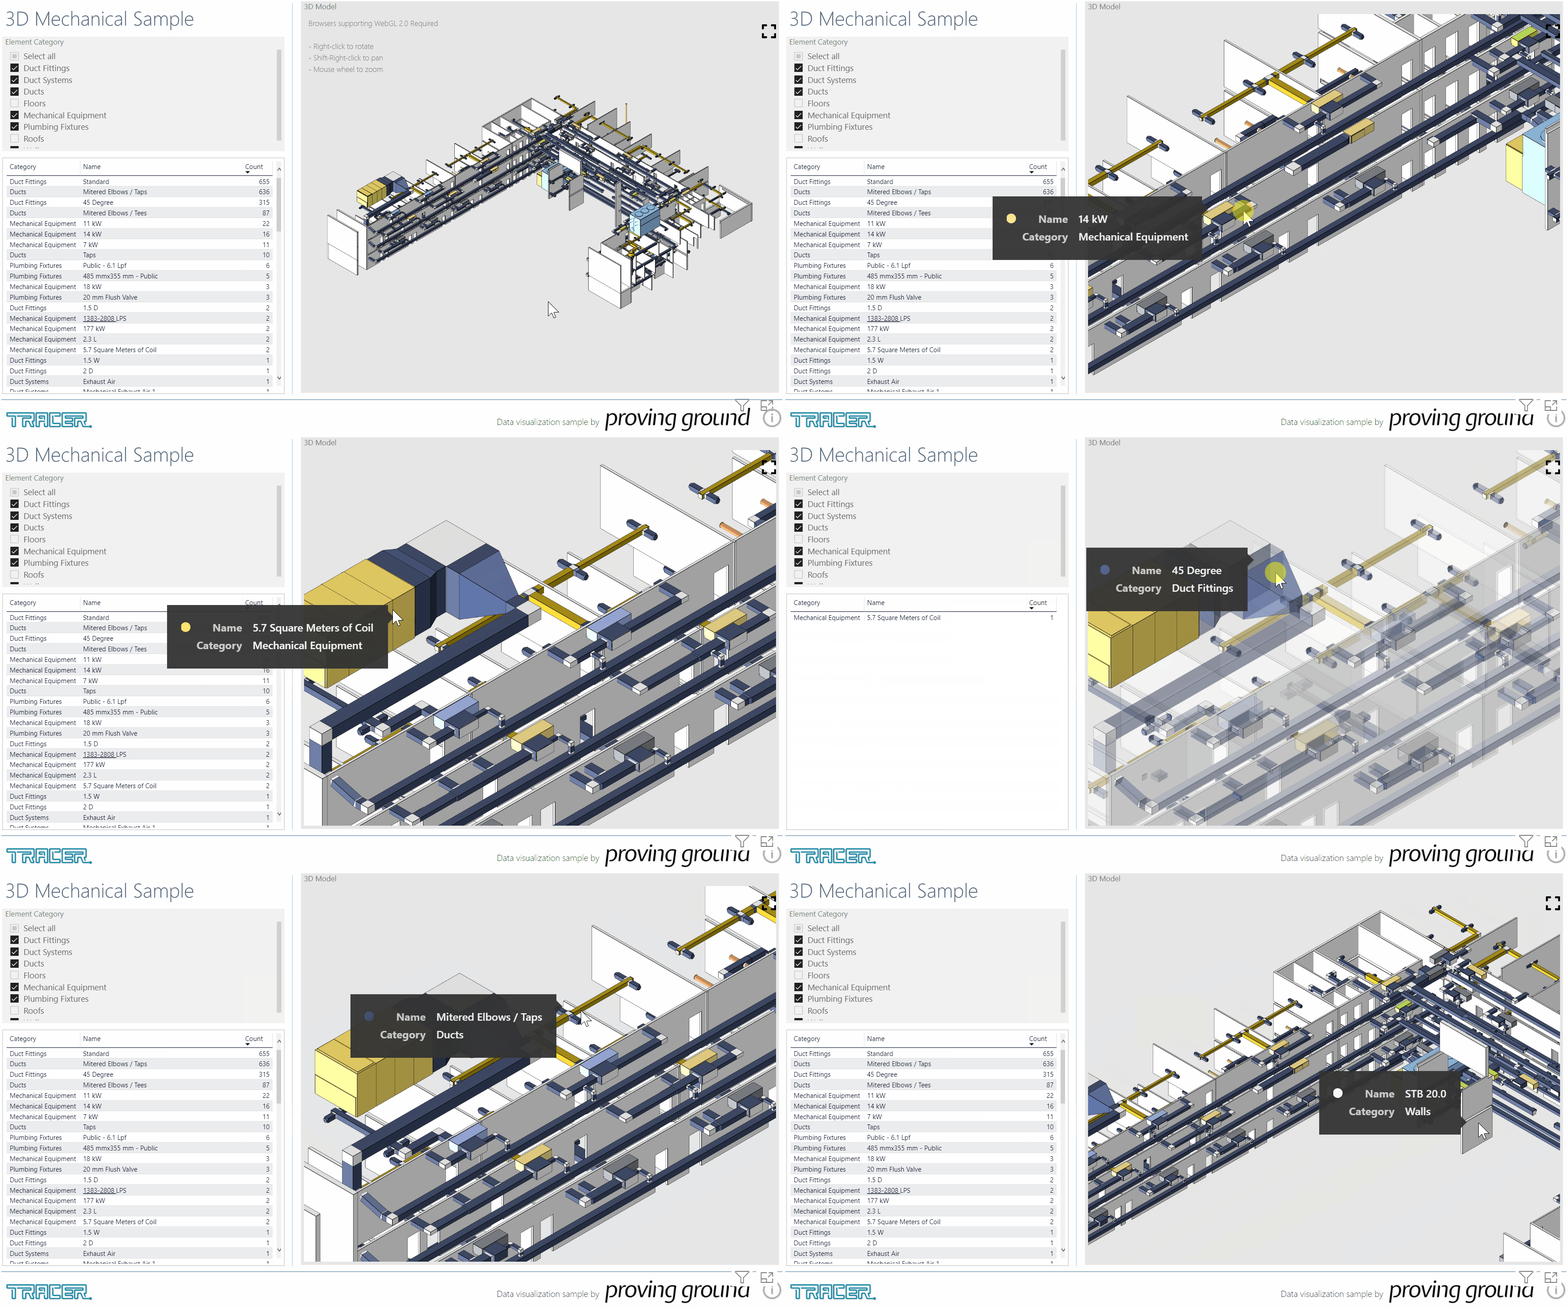
Mechanical Elements
This dashboard shows 3D Revit mechanical elements for use in coordination activities.
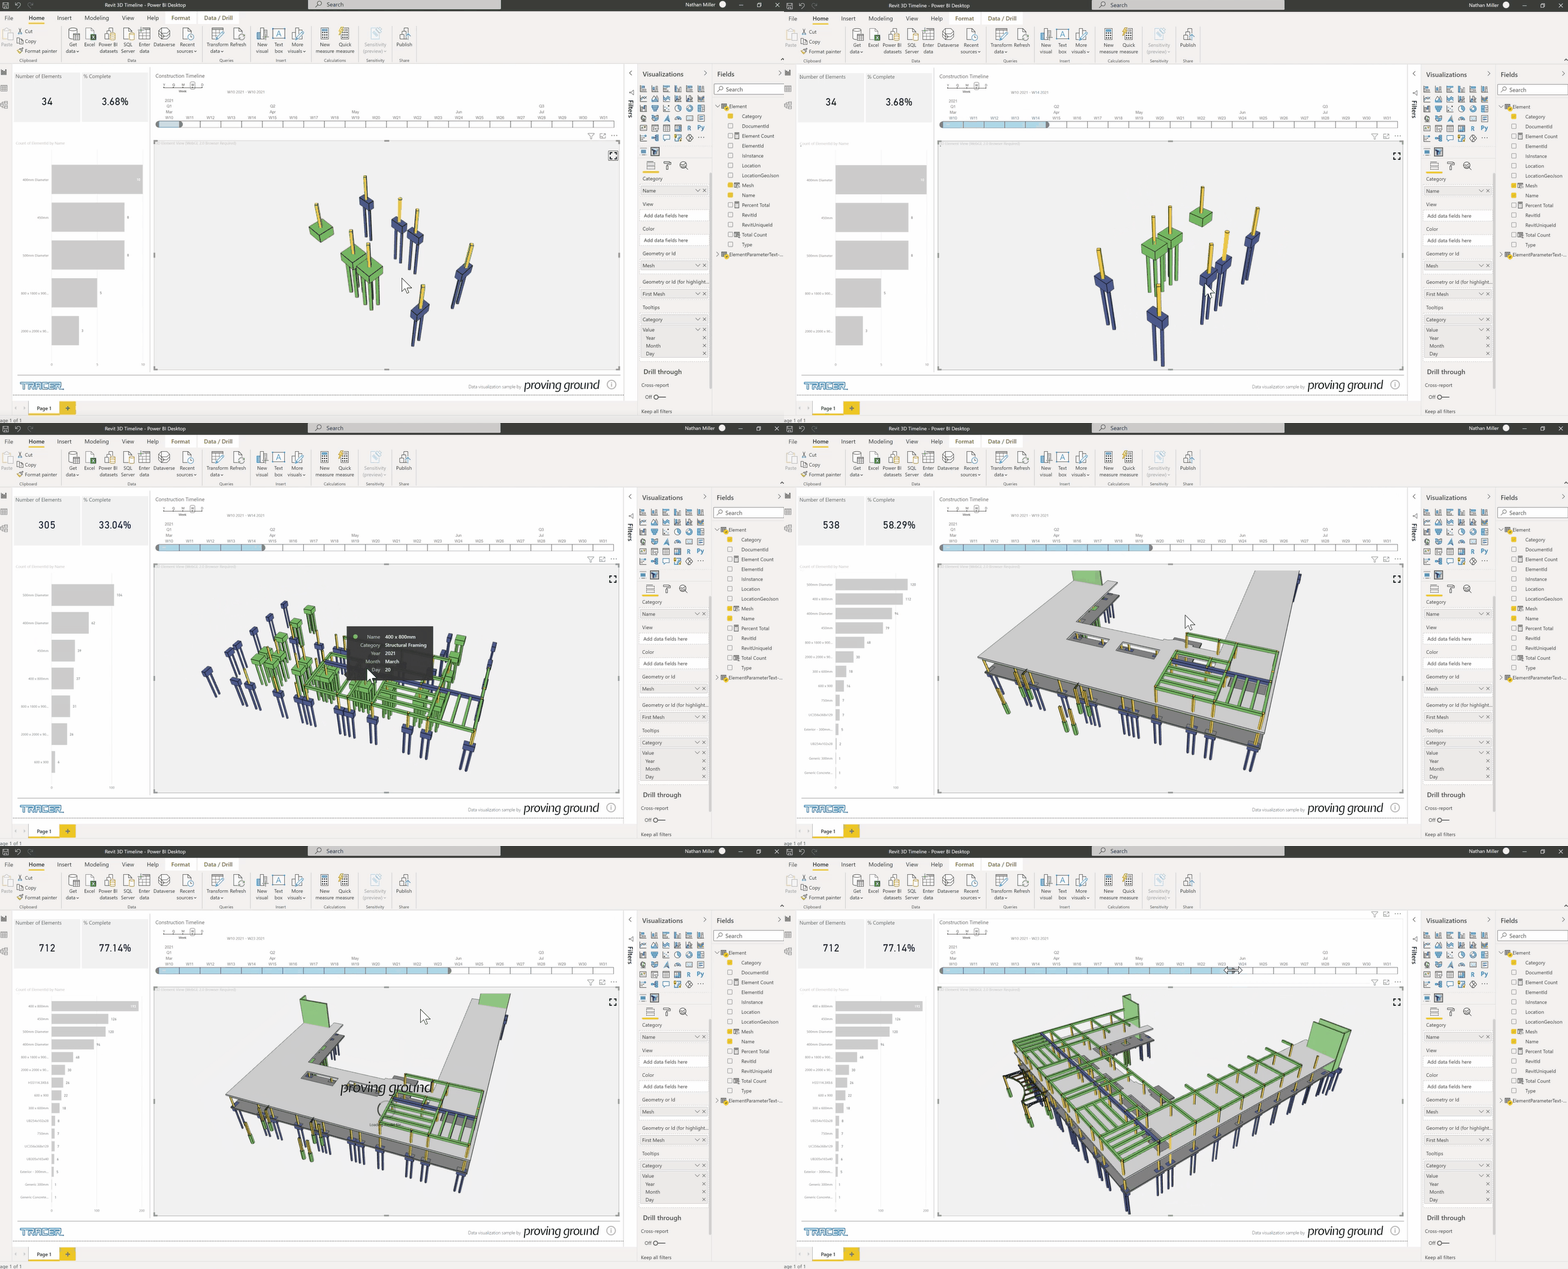
Construction Timeline
This dashboard shows 3D Revit structural elements coordinated on a construction timeline in Power BI.
