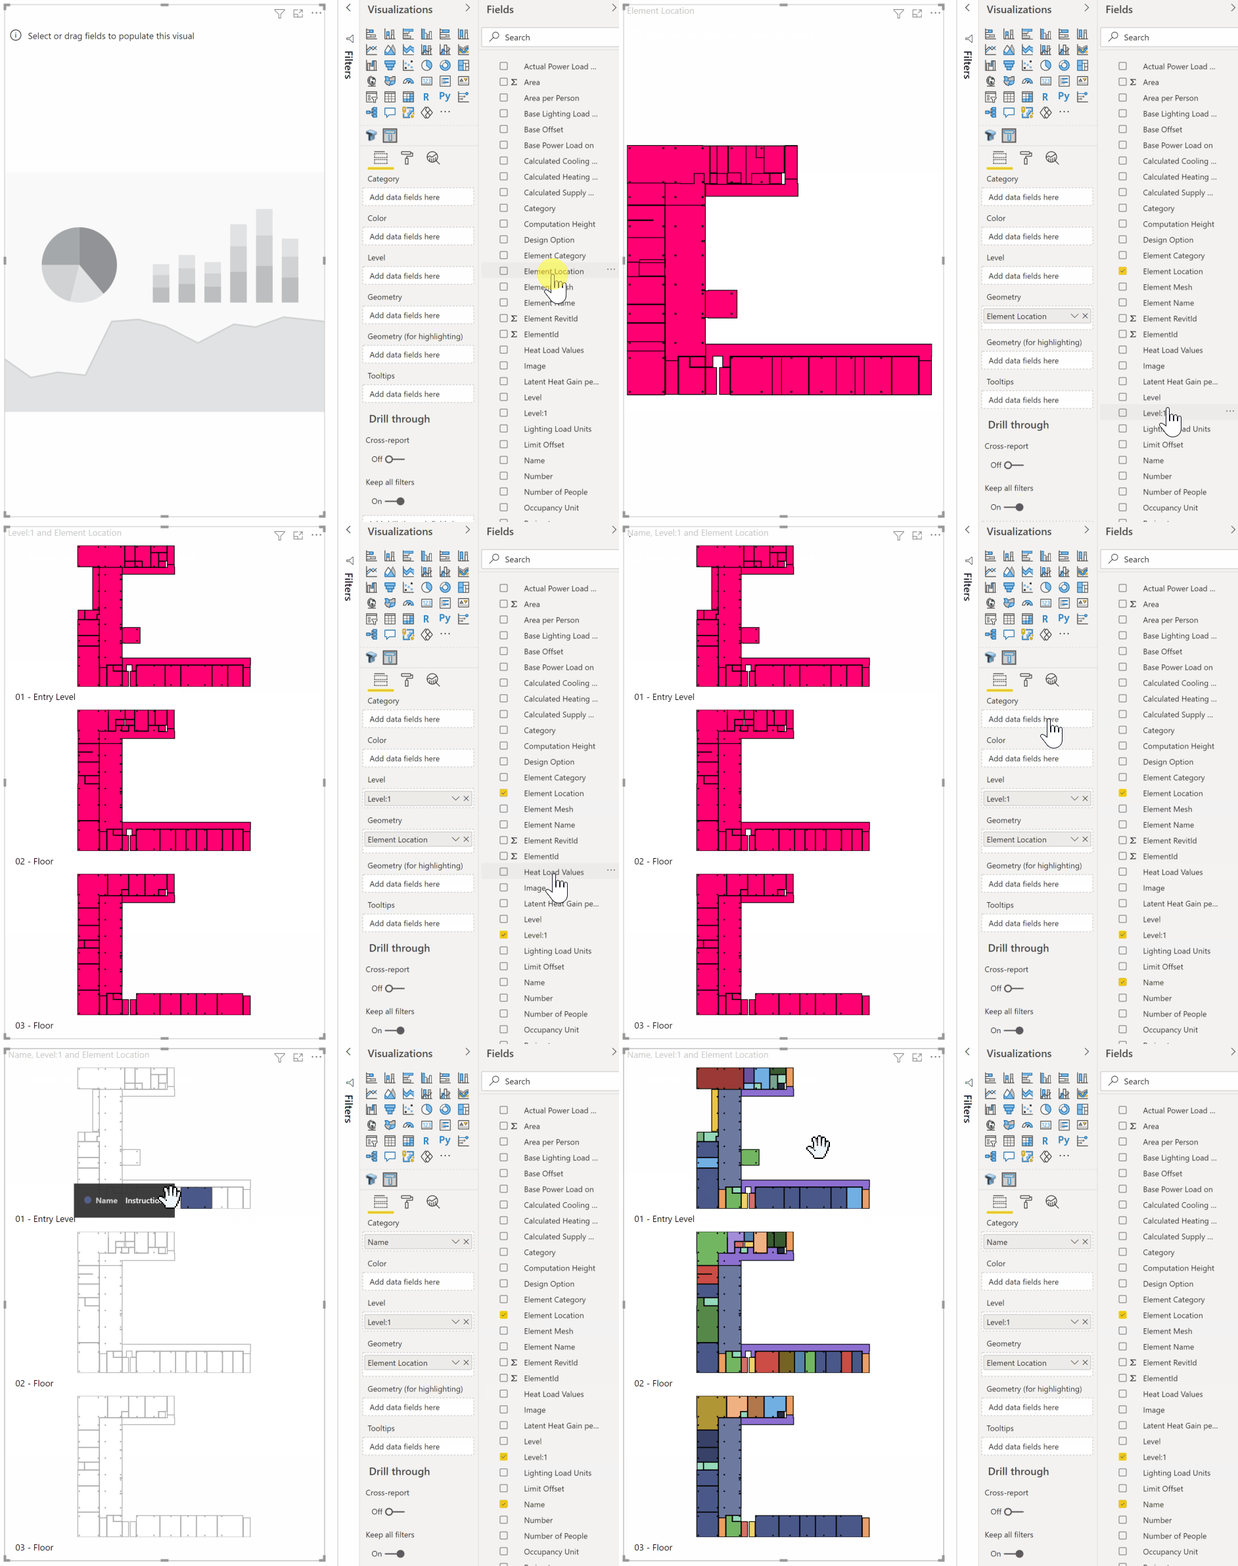
The Power BI Tracer 2D visual allows users to render 2D geometry using spatial field data. This allows users to produce interactive diagrammatic visuals from database records.
- Drag-and-drop 2D geometry records into the visual for display.
- Pan and zoom features for navigating the visual geometry.
- Interactive selection, filtering with other Power BI report elements.
- Provides formatting controls to change the ‘look and feel’ of the visual
- Ability to designate objects as Context to independently control their appearance
- Capability to use Power BI’s Conditional Formatting to enhance the visual’s data-rich appearance

