1. Reference the RoomElements View Table from a SQLite DB
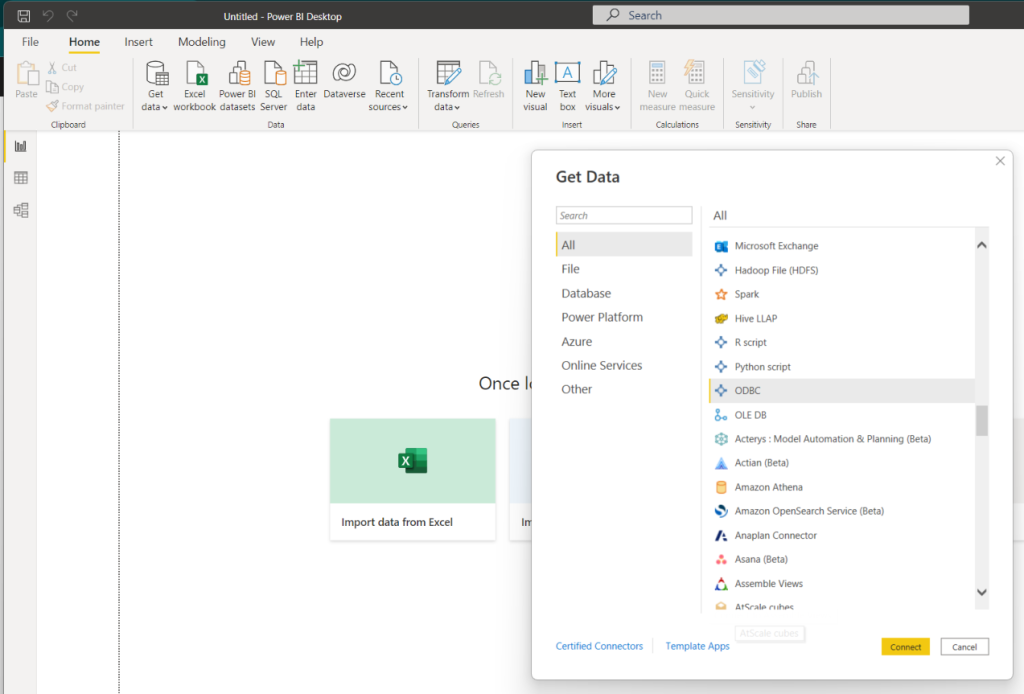
Get data from a Revit exported SQLite database. Select “Get Data” and choose ODBC.
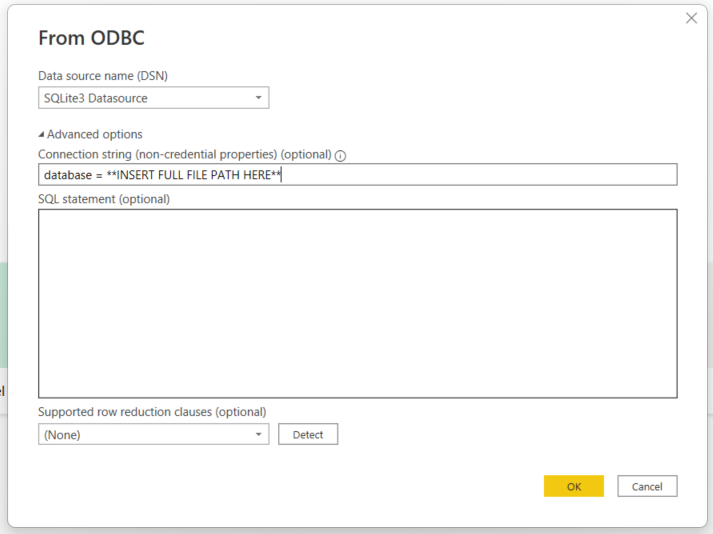
From the DSN Options, select “SQLite3 Datasource”. Expand the Advanced Options menu and enter “database = full file path“.
If you are copying and pasting your file path from another location, be sure to remove any quotation marks. Then choose “Ok”.
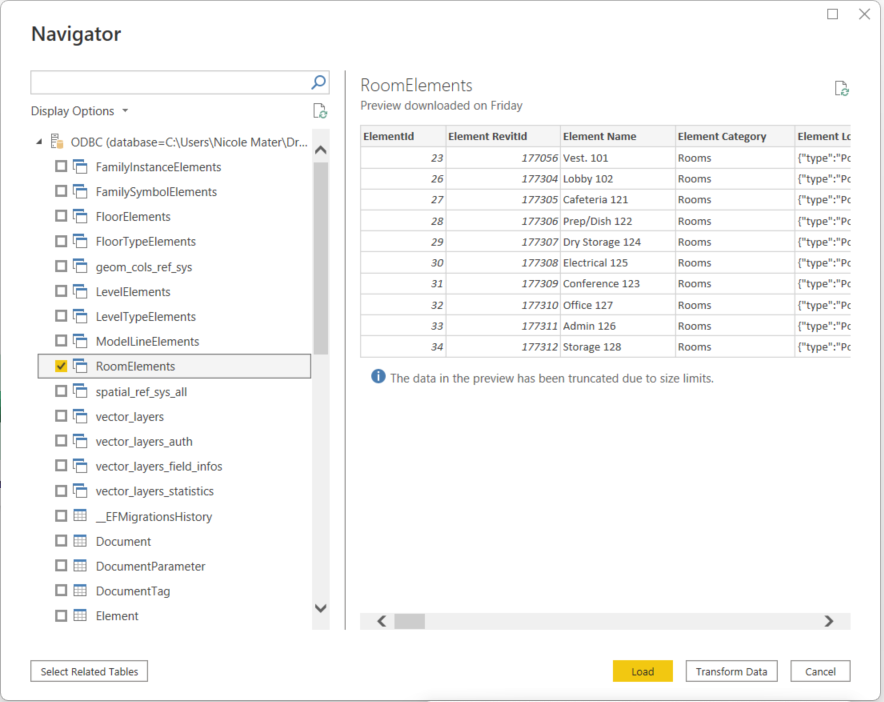
In the table navigator, find the “RoomElements” view. Then select Load
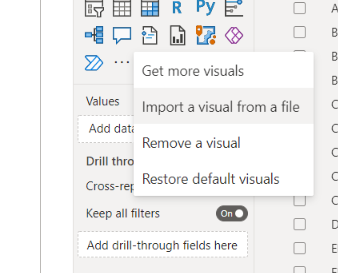
2. Import the Tracer 2D Visual
Under the Visualizations menu, choose “Get More Visuals” and choose to “Import a visual from a file”
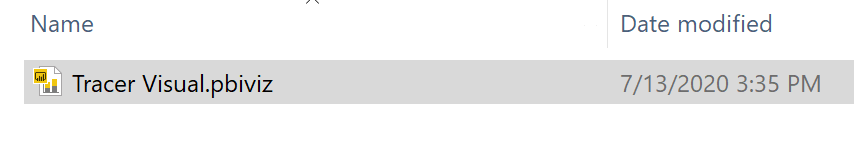
Navigate to the Tracer visual (installed under the Documents\Proving Ground\Tracer)
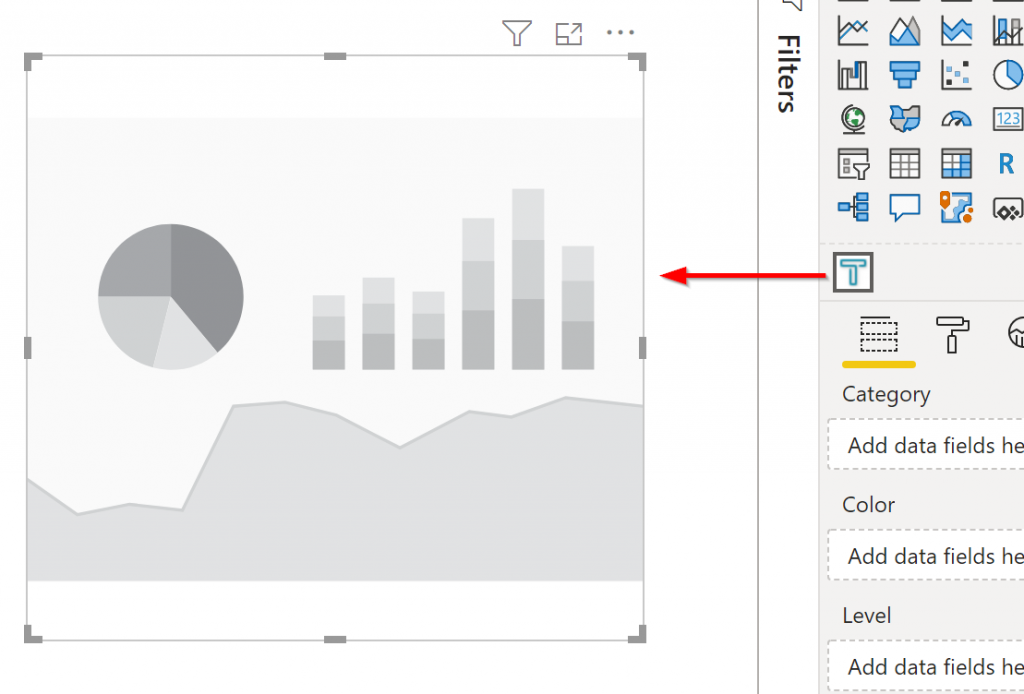
3. Place a Tracer 2D Visual onto the Report Canvas
Select the newly imported Tracer visual to place an instance of it on the report canvas.
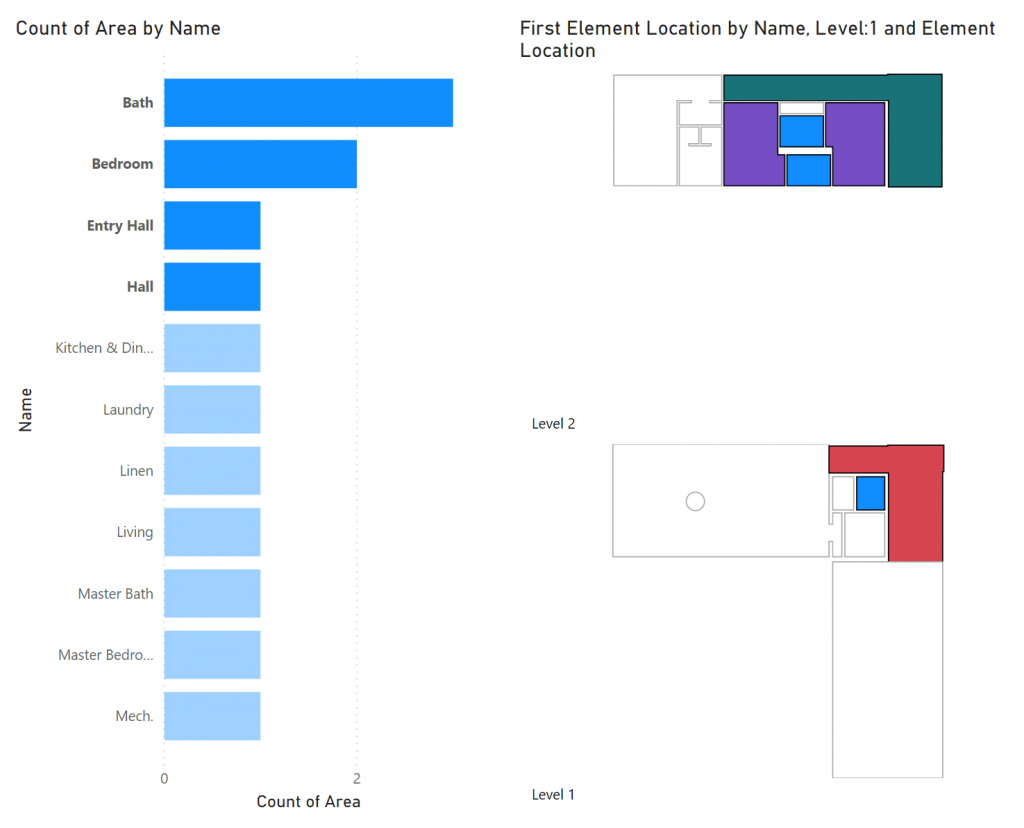
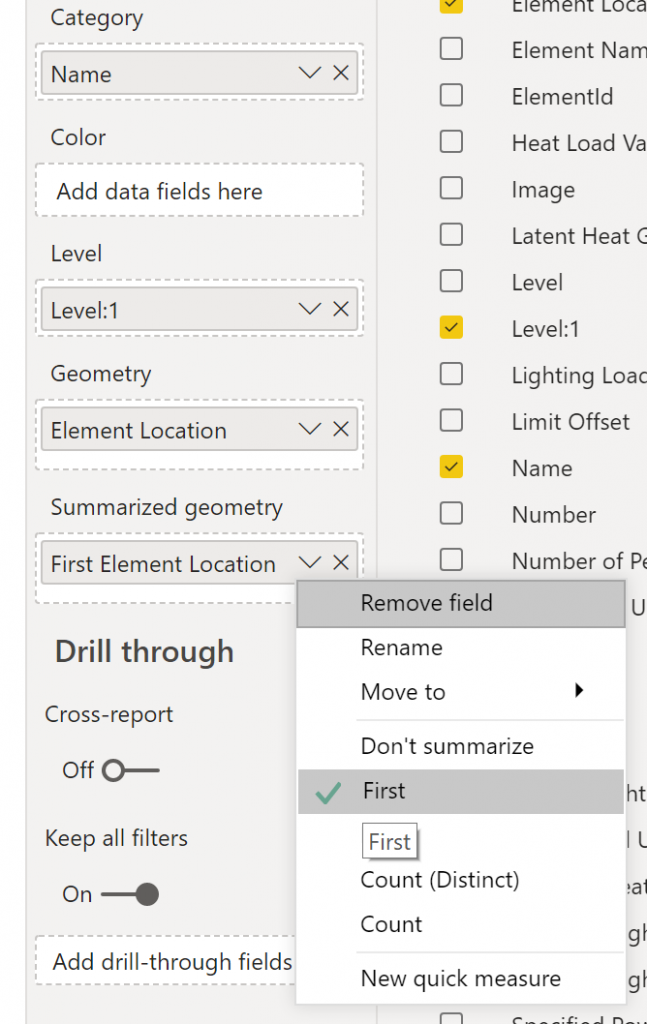
4. Set the Geometry Fields with Room Location
Set the following Visual fields as follows from the RoomElements table:
- Category: “Name”
- Level: “Level:1”
- Geometry: “Element Location”
To fully support visual cross-filtering, it is also important to set the “Summarized Geometry” field. This field should also used the “Element Location” field but should be set to be summarized using First, Last or other type.
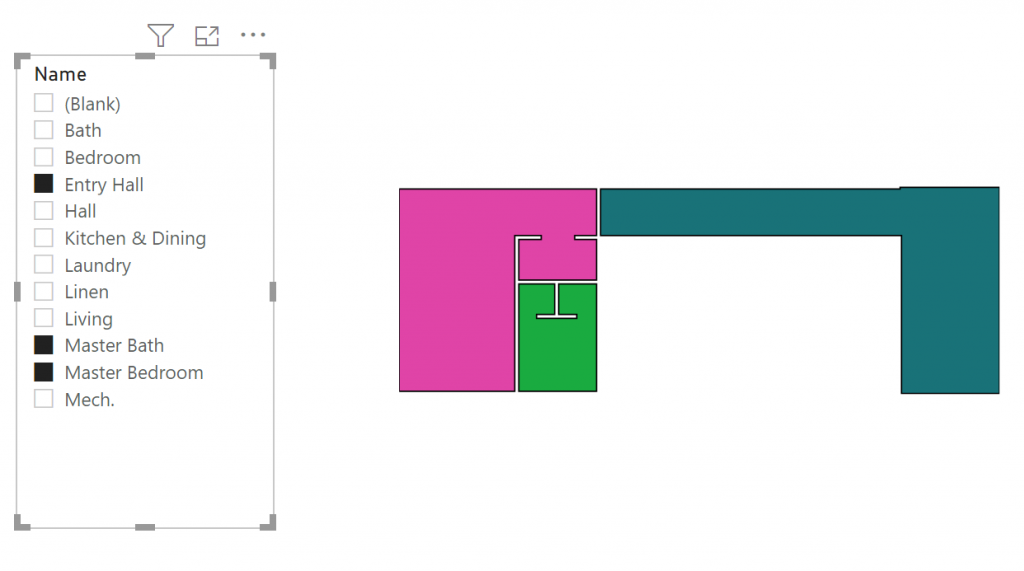
5. Test a Slicer to Filter the Rooms Visual
Place a new “Slicer” visual and test filtering by the RoomElement Name field.
6. Test Filtering from another visual
Place a graph visual set with the RoomElement Name and a measure, such as Area.