Summary
The Tracer visual includes a way to parse 3D elements into “groupings” contained within separate 3D views. The “multi-view” is useful to show related elements in parallel views and explain complex systems or compare options.
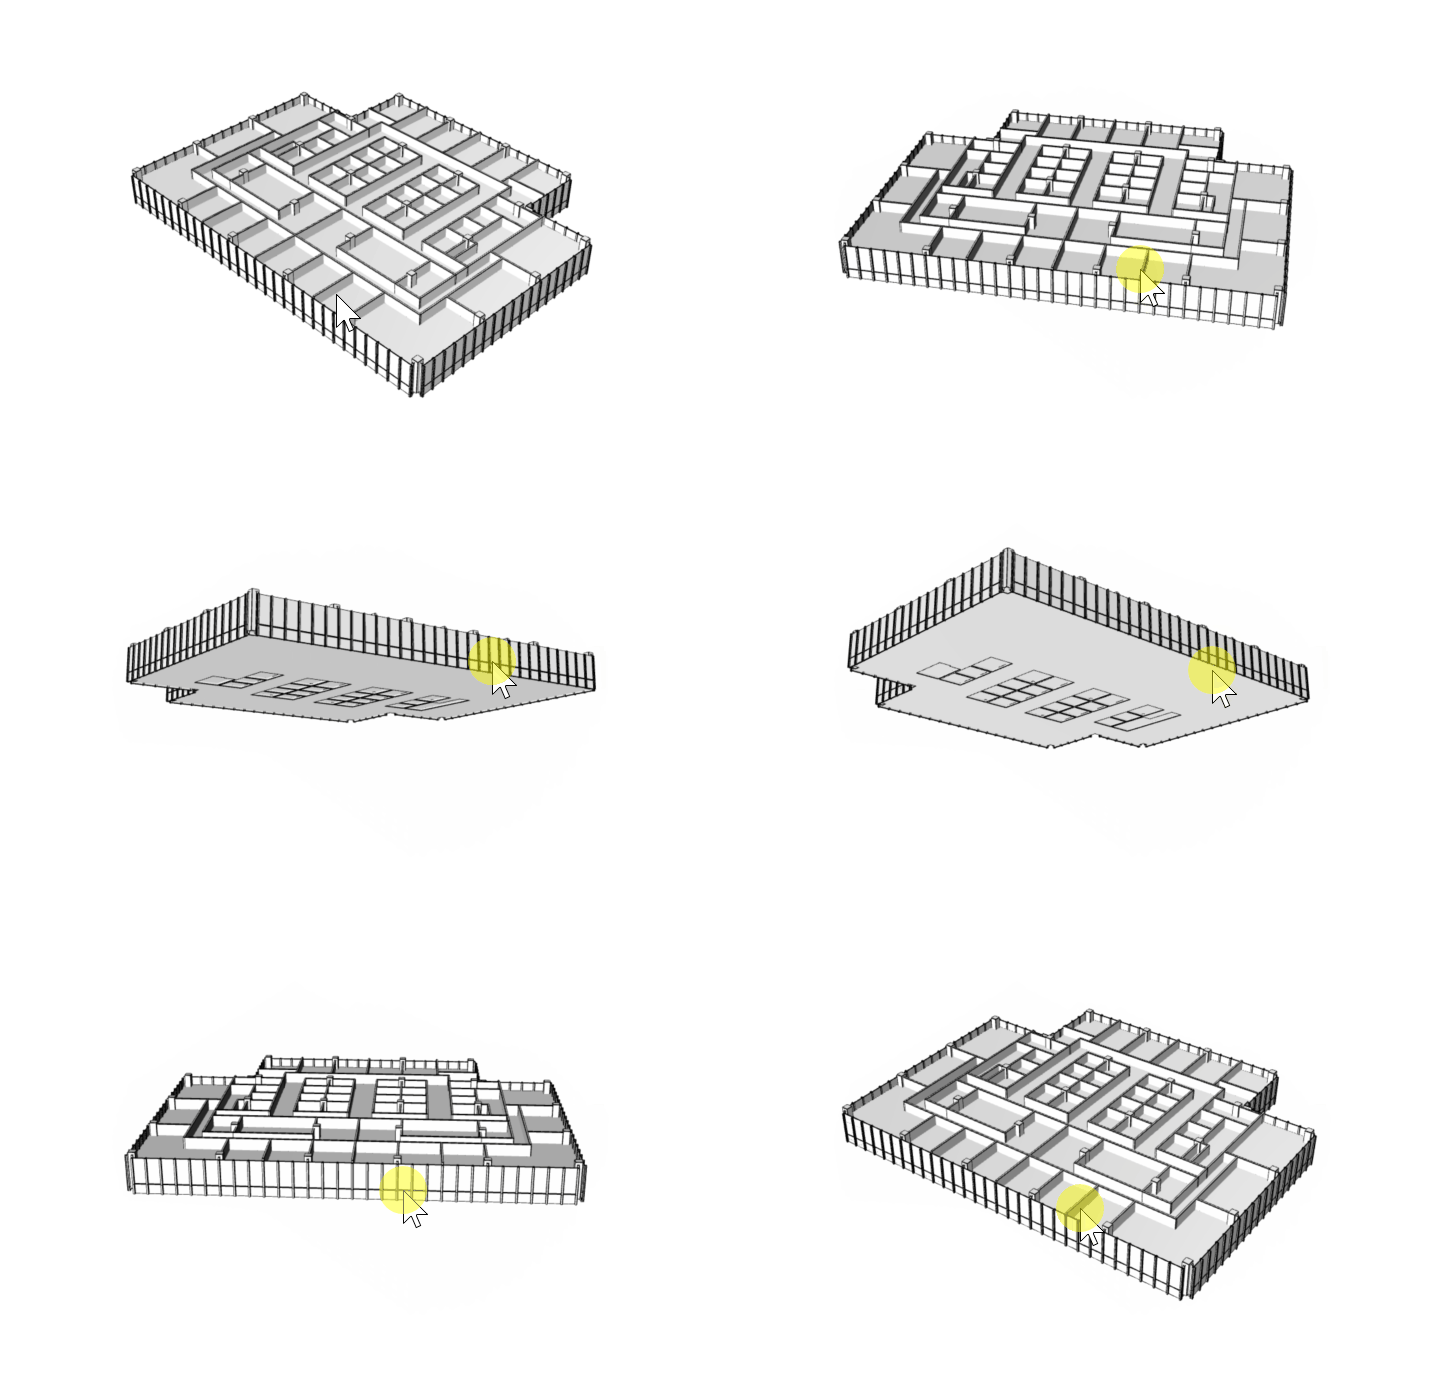
New in Tracer V3, cameras can be linked or unlinked between views.
1. Set up a 3D Tracer visual and connect it to elements
Create an instance of the 3D visual and provide it with your element mesh geometry. (Learn how here)

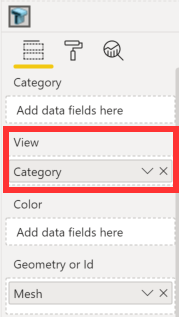
2. Set a “Views” field to group the geometry
Provide a field to the “Views” input of the 3D visual. This field will organize your geometry into separate groups.

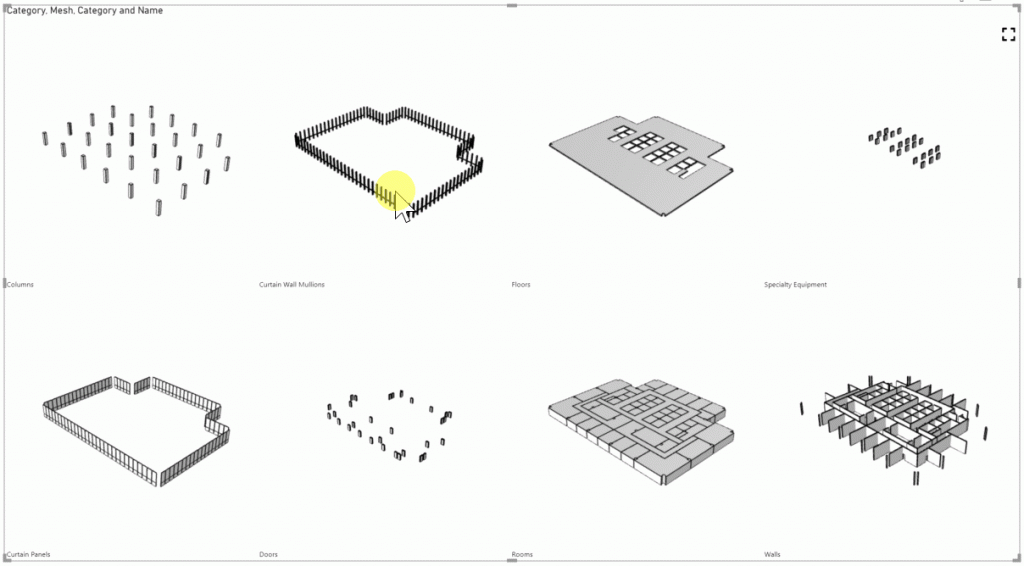
3. Review how the geometry is grouped into separate 3D views
Geometry will be grouped according to the values suppled into the “Views” input.

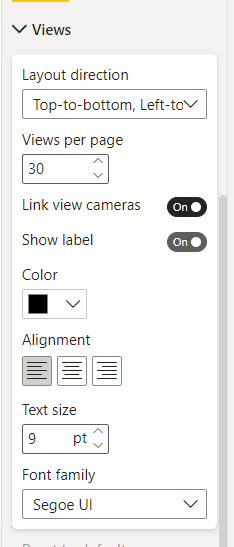
4. Link and Unlink Cameras
Navigate to Visualizations > Format Visual > Visual > Views and locate the toggle “Link view cameras”. Turning this toggle on will synchronize the cameras of each view in the visual. Turning this toggle off will allow cameras to be controlled independently.

